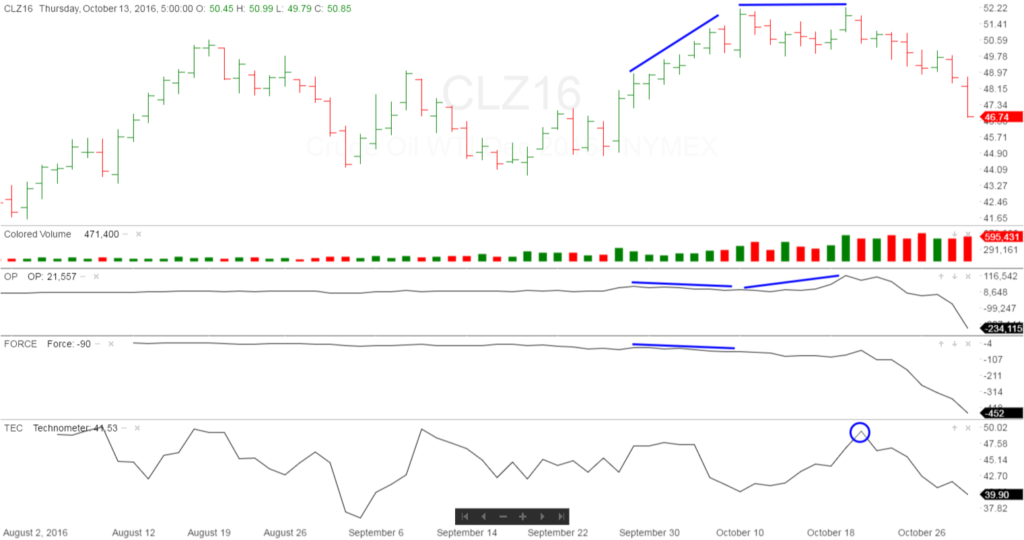
Here is something everyone might find interesting. This is a example of a Wyckoff double divergence.....
The following chart shows a recent double divergence between the OP/Price for December Crude Oil Futures.
You can see that as the Technometer reached overbought at the blue circle, the price made its final high, and has been in a sustained downtrend since. It is now entering oversold territory, so we would expect a corrective rally.

- Forums
- General
- Wyckoff trading method
Wyckoff trading method, page-1117
-
-
- There are more pages in this discussion • 1,342 more messages in this thread...
You’re viewing a single post only. To view the entire thread just sign in or Join Now (FREE)
Featured News
Featured News
The Watchlist
ACW
ACTINOGEN MEDICAL LIMITED
Andy Udell, CCO
Andy Udell
CCO
SPONSORED BY The Market Online


