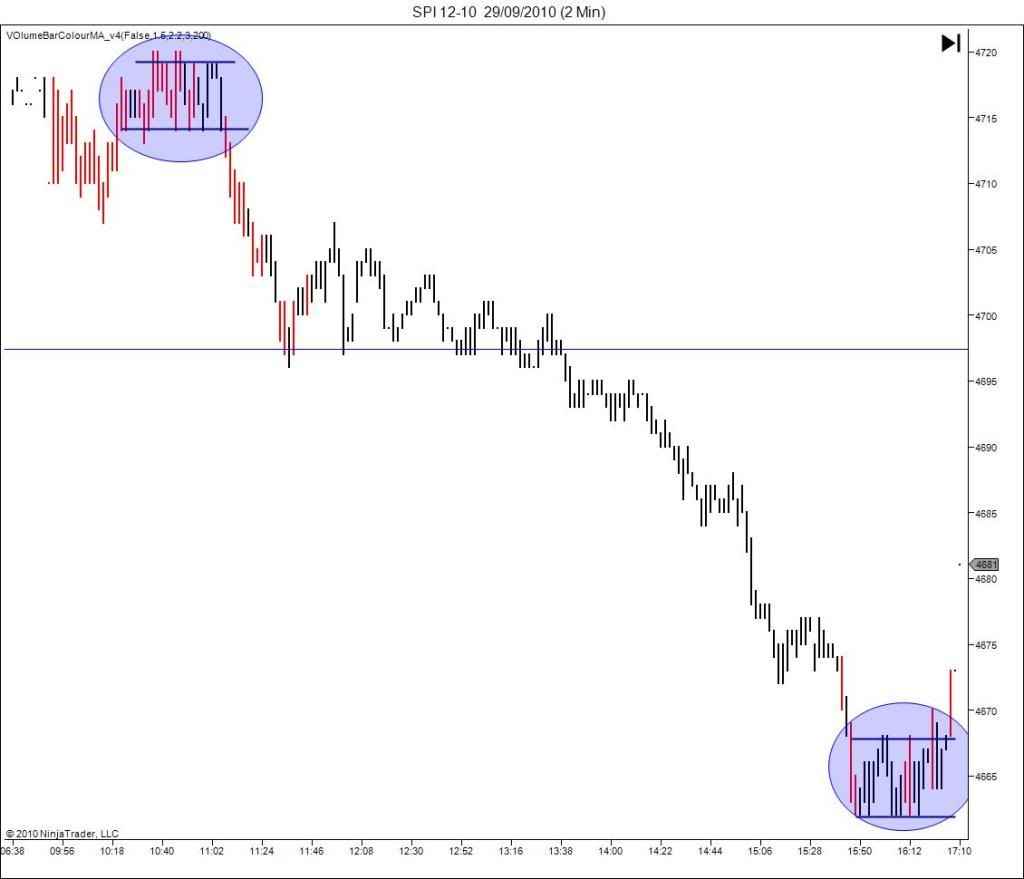
this is a chart of the asx200 futures contract SPI ..on wednsday 29th of sep.I was activly trading this market .
the 2 areas I have highlighted are at the opening HR and closing HR of the day .ON each occasion the bots held the market in about a 6 tick range.
A way of trading this is to wait for a breakout of the small range ,the trick is to recognise when this is happening.
What was intresting to me was that this activity took place at the extremes of the recient range , under normal surcumstances markets will spend very little time at the extreme price levels ..but in this case they used the bots to create a situation that was unchararistic, holding the market at the extreme for an extended period .. Intresting.
- Forums
- General
- trading techniques
this is a chart of the asx200 futures contract SPI ..on wednsday...
Featured News
Featured News
The Watchlist
ACW
ACTINOGEN MEDICAL LIMITED
Andy Udell, CCO
Andy Udell
CCO
SPONSORED BY The Market Online


