Has Cazaly being lost in the port allocation ring?
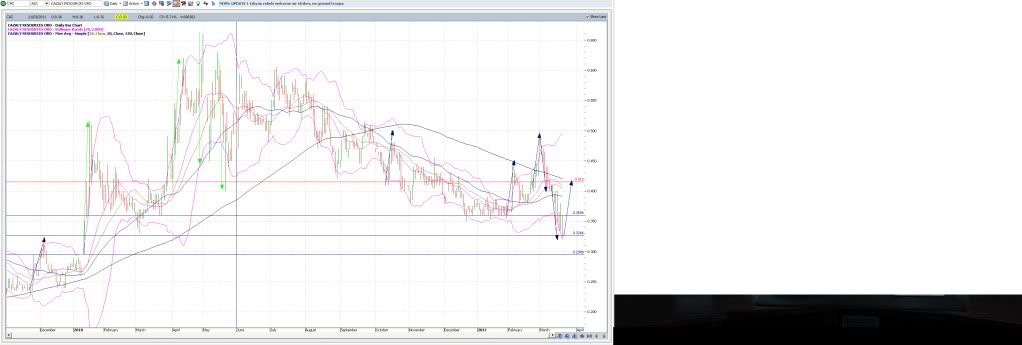
I got a new monitor with one screen however, when i try and copy images it seems to think I have 2 - hence the backgroud image attached ?? Hmmm anyway I had to do a chart since there is so much jibber jabber nonsense floating around this CAZ forum.
As you can see:
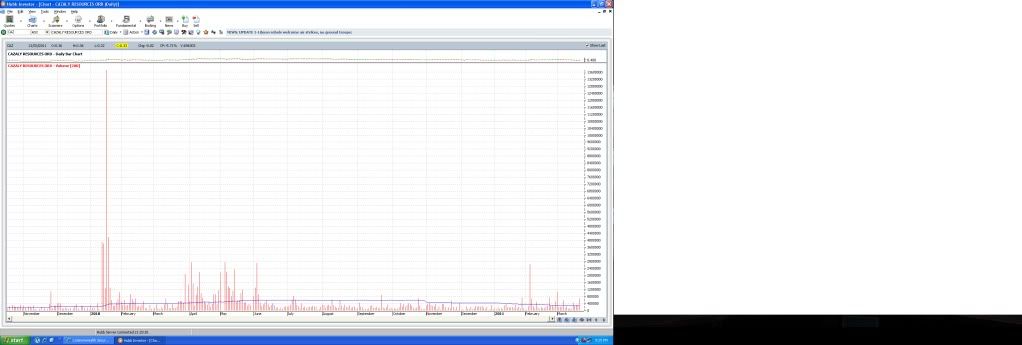
1. Volume - in the scheme of things shows no indication of inside knowledge - thus sell down is triggered more on psychological fear than anything.
2. Bolligerband - we are at the bottom of the bolliger bands indicating oversold
3. Green repeating and reversal arrows - as you can see before June 2010 (cut off period to chart), Caz was very volatile and following the green arrow pattern in terms of returns.
4. Blue repeating and reversal arrow - as you can see after june 2010 (cut off date) there has been many annoucements to the market. Hence, the arrows are shorter and returns less volatile. The latest turn of events to 32.5 have seen the revesal of the blue arrow being filled.
So we have shown that there is zero inside information leaked atm and that bruties and geezers marraige with the taxi driver is still on in nevereverland.
Go back to jan 2010. You see the spike in volume??? Now that is some information volume spike there. Now compare this to todays volume? Does not compare at all...
So where does that leave us?
1. We have broken the support today hitting an intra-day low at 32.5 cents; however we closed at the support level of 33 cents.
a. we bounce from this level indicated by the blue arrow to 41 cents
b. we fall to a new support and next long term low support line of 29.5 cents.
My bet is on the rise. Why?
Fundamentally, lybia and japan have rocked world markets and has stirred up immense uncertainty; thus plummeting stock prices all around the world. CAZ is still feeling the effects from the macro level as it is factoring through to its fundamentals - we havent had an annoucement for such a long time, so panic is in town and hence the recent sell down. I expect that when confidence returns to the markets, caz will bounce to old territory. Furthermore, NM recent buy wouldnt have been executed if he didnt think port approval was on table.
Conclusion: Brutie and geezer are mental with this taxi driver nonsense. The technicals aren't bullish anymore, however the technicals say to me oversold and I put my analysis as SHORT term BUY on the climb back to 40 cents. I tried to get in today at 32.5 cents but my chance was gone in under a minute
Cheers.
- Forums
- ASX - By Stock
- CAZ
- technicals update 21st march 2011
technicals update 21st march 2011
-
-
- There are more pages in this discussion • 37 more messages in this thread...
You’re viewing a single post only. To view the entire thread just sign in or Join Now (FREE)
Featured News
Add CAZ (ASX) to my watchlist
 (20min delay) (20min delay)
|
|||||
|
Last
1.6¢ |
Change
0.001(6.67%) |
Mkt cap ! $6.458M | |||
| Open | High | Low | Value | Volume |
| 1.5¢ | 1.6¢ | 1.5¢ | $13.34K | 837.0K |
Buyers (Bids)
| No. | Vol. | Price($) |
|---|---|---|
| 4 | 481859 | 1.5¢ |
Sellers (Offers)
| Price($) | Vol. | No. |
|---|---|---|
| 1.6¢ | 467811 | 1 |
View Market Depth
| No. | Vol. | Price($) |
|---|---|---|
| 1 | 100000 | 0.025 |
| 2 | 100000 | 0.024 |
| 2 | 143478 | 0.023 |
| 3 | 320000 | 0.022 |
| 2 | 156893 | 0.020 |
| Price($) | Vol. | No. |
|---|---|---|
| 0.029 | 92582 | 1 |
| 0.030 | 148628 | 5 |
| 0.031 | 225846 | 2 |
| 0.033 | 54000 | 2 |
| 0.034 | 100000 | 1 |
| Last trade - 12.36pm 04/12/2024 (20 minute delay) ? |
Featured News
| CAZ (ASX) Chart |


