Silver Is Like A Coiled Spring
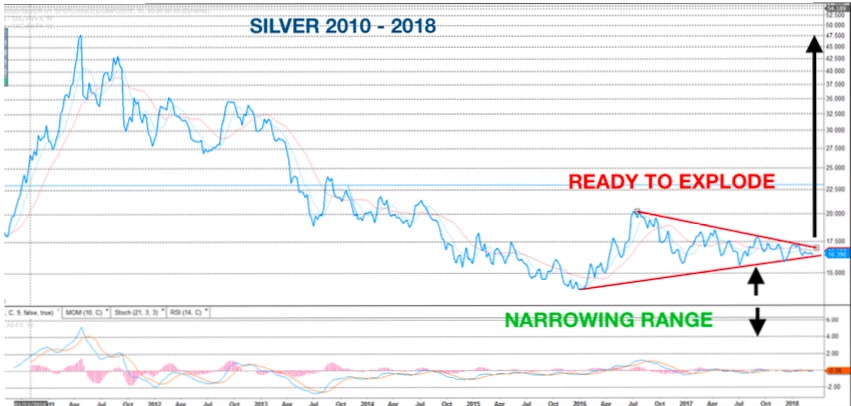
As gold most probably soon takes off, silver is like a coiled spring which will explode. For 3 1/2 years, silver has traded in a range which has become increasingly narrow. In the last 15 months the range has got even smaller as seen in the chart below. The technical indicator MACD in the chart has also shown very little oscillation for 4 years and even less so since the beginning of 2017. The upper and lower trend lines also show the narrowing range.
As often when there is a breakout out of a triangle, there can first be a move in the other direction. Thus we could see a brief move down of gold and silver first and then a very fast surge to the upside.
Headfake Lower Before Silver Explodes Higher
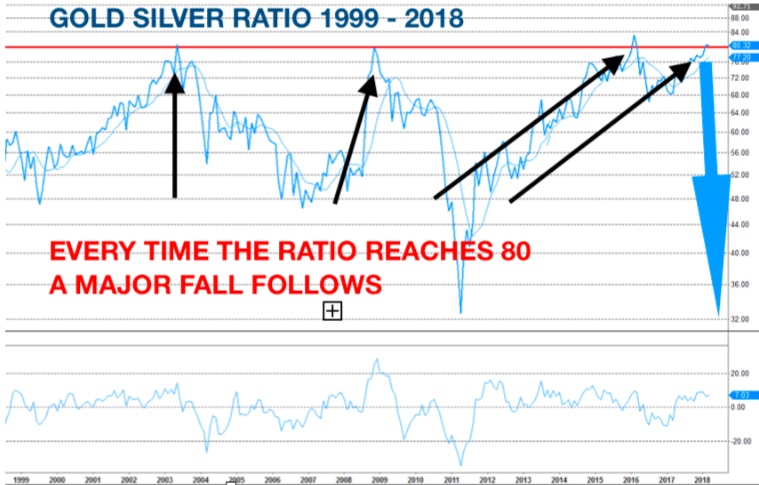
The gold/silver ratio, which is just above the 80 level for the 4th time since 2003, is another very good indication that silver will lead the surge of the precious metals. Every time the ratio reaches that level and turns down, silver moves up twice as fast as gold.
Silver Price To Radically Outperform Gold
Thus, there are many indications that silver is now ready to move up very fast. Since there is very little physical silver available, the coming move should be explosive. So hold on to your seats but buy silver (and gold of course) first.”
- Forums
- ASX - By Stock
- Silver Like a coiled spring??? from KWN
Silver Is Like A Coiled Spring As gold most probably soon takes...
-
-
- There are more pages in this discussion • 28 more messages in this thread...
You’re viewing a single post only. To view the entire thread just sign in or Join Now (FREE)
Featured News
Add ARD (ASX) to my watchlist
 (20min delay) (20min delay)
|
|||||
|
Last
2.5¢ |
Change
0.001(4.17%) |
Mkt cap ! $25.26M | |||
| Open | High | Low | Value | Volume |
| 2.3¢ | 2.5¢ | 2.2¢ | $114.3K | 4.950M |
Buyers (Bids)
| No. | Vol. | Price($) |
|---|---|---|
| 3 | 345000 | 2.4¢ |
Sellers (Offers)
| Price($) | Vol. | No. |
|---|---|---|
| 2.5¢ | 1492102 | 4 |
View Market Depth
| No. | Vol. | Price($) |
|---|---|---|
| 4 | 1346600 | 0.013 |
| 3 | 900254 | 0.012 |
| 5 | 5562933 | 0.011 |
| 2 | 550000 | 0.010 |
| 1 | 500000 | 0.009 |
| Price($) | Vol. | No. |
|---|---|---|
| 0.014 | 867091 | 1 |
| 0.015 | 1101911 | 3 |
| 0.016 | 200000 | 1 |
| 0.017 | 464733 | 2 |
| 0.018 | 187500 | 1 |
| Last trade - 16.10pm 18/11/2024 (20 minute delay) ? |
Featured News
| ARD (ASX) Chart |


