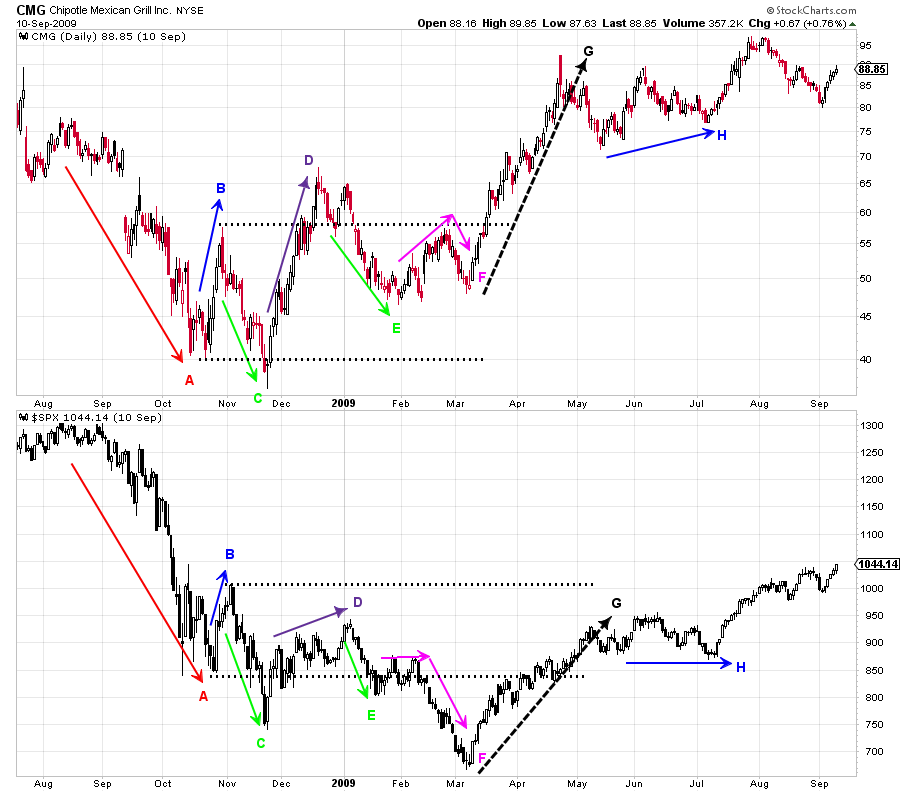
Hi guys been a bit quiet around here,
Some charts of interest to me;
COMMODITIES: General trend is they're starting to look better
Zinc - Trying to form a base here and pressing against DTP. Watch for a push through. China shuts down a lot of smelters during winter so it should add to the supply squeeze with stockpiles already at 5year lows.
Copper - Has formed a base now after a small undercut of support. Its beginning to form a tight flag here, key will be a break above yellow and follow through blue resistance.
Nickel - Got this one wrong. Continues pushing lower, lots of supply coming out of Indonesia and China has put out plans for expansion and production upgrades. What will be needed to turn this ship around and make it a market thematic will be a major discovery in batteries. The push continues for battery makers to reduce cobalt and increase nickel however no manufacturer has successfully completed this. Only a handful of elements exist which is able to change valency automatically to remain electrically neutral while lithium ions move about (Cobalt, Nickel, Copper, Iron, Chromium, Zinc, Manganese). Out of these only cobalt can remain 100% structurally integral while having upto 60% of lithium ions removed from the cathode. When Nickel changes valency its oxidized state is very reactive and releases large amounts of flammable gas. So far from my research solutions battery makers are exploring to get around this is doping cathode with Aluminium, Manganese. Coating the cathode with material that reduces reactivity and putting additives into the electrolyte to decrease reactivity. Will be interesting if a solution is found in the near future, also needs to be economic.
Worth watching to see if it can push through DTP here then form a base.
MACRO
Shanghai Composite - Looks to have found an ST low, likely with the strengthening of metals, namely recent chart action looks alot like zinc chart above.
XJO - Zoom out shows previous times it has had a break in ST trend (Yellow) and has pullbacked to LT trend (Green) which has basically paved the way and held up since GFC, has been the basis for this bull cycle. Green trendline will make for a good low risk entry into markets with stops right below trend.
Zoom in shows a spring so far for this week. See if it closes upper half close of business today. Good sign of early stopping volume, not to say it wont go lower into green trendline but healthy to see signs of strength as it approaches closer to key support levels.
XEC - A different story here, has been trashed of highs but on positive looks very stretched here and sitting on LT support zone. Although I put emphasis on zone as it hasn't shown signs of stopping just yet at this top support level. However, I do expect it to hold up somewhere around this yellow zone.
CAC - Looks similar to XJO action. Also coming back to reality of the long term trend line since post-GFC with most european markets.
Finally,
OIL - Been bearish for last 4weeks. Beautiful well behaved chart from the get go, and a great example of trading SOT (Shortening of Thrust) action. SOT ranked by few authors as second strongest reversal signal (second place to climatic action), also one of my fav patterns, especially if Fundamentals align for a "turnaround" story.
SOT was on the downside late last year, followed by a clean breakout and mad rally. Over last month SOT started showing itself on upside, followed by breakdown and mad rally downwards this time.
Lithium ETF starting to show a similar pattern - however very early days still. Might take one or two more downward pushes being rejected/shortening.
Another example;
Cheers
- Forums
- ASX - Short Term Trading
- Short Term Trading Week Starting: 19 November 2018
Hi guys been a bit quiet around here,Some charts of interest to...
-
- There are more pages in this discussion • 14 more messages in this thread...
You’re viewing a single post only. To view the entire thread just sign in or Join Now (FREE)
Featured News
Add XAO (ASX) to my watchlist
 (20min delay) (20min delay)
|
|||||
|
Last
8,705.0 |
Change
5.900(0.07%) |
Mkt cap ! n/a | |||
| Open | High | Low |
| 8,699.1 | 8,727.7 | 8,694.0 |
Featured News
| XAO (ASX) Chart |


