@Myrkient did you mean C&H on the weekly?
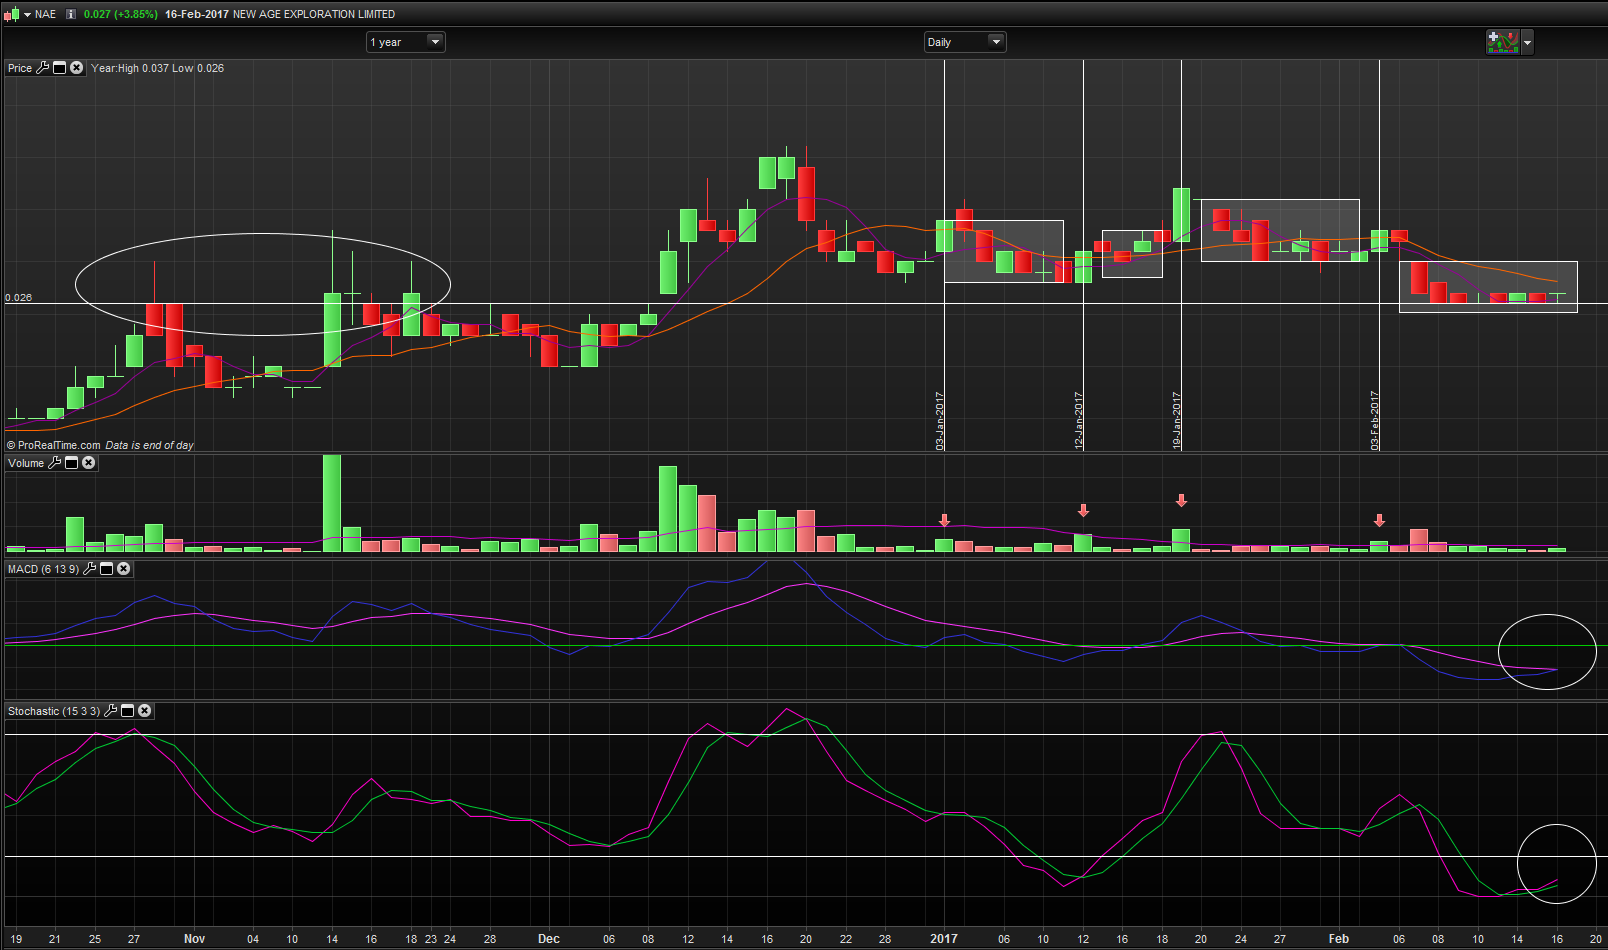
It does look like we're under textbook accumulation before any updates come out.
Keep in mind there's only 7 trading days left in Feb - the month where we're expecting news. Reminds me of the accumulation phase GPP went through.
Sitting on old resistance gives quite strong support for any last accumulation before our next leg up imo.
I've marked what seems to be large buy ins on an increase in volume, followed by flush out of retail sellers over a few days, then hit again with another large buy in.
Supply looks to have dried up over the last week though.
MACD looks to be turning up, and stochastics suggest highly oversold.

- Forums
- Charts
- NAE Chart
@Myrkient did you mean C&H on the weekly? It does look like...
-
- There are more pages in this discussion • 568 more messages in this thread...
You’re viewing a single post only. To view the entire thread just sign in or Join Now (FREE)
Add NAE (ASX) to my watchlist
 (20min delay) (20min delay)
|
|||||
|
Last
0.5¢ |
Change
0.000(0.00%) |
Mkt cap ! $7.175M | |||
| Open | High | Low | Value | Volume |
| 0.0¢ | 0.0¢ | 0.0¢ | $0 | 0 |
Buyers (Bids)
| No. | Vol. | Price($) |
|---|---|---|
| 36 | 19547419 | 0.4¢ |
Sellers (Offers)
| Price($) | Vol. | No. |
|---|---|---|
| 0.5¢ | 14254057 | 11 |
View Market Depth
| No. | Vol. | Price($) |
|---|---|---|
| 2 | 2200000 | 0.006 |
| 9 | 8299899 | 0.005 |
| 6 | 3650000 | 0.004 |
| 3 | 2622888 | 0.003 |
| 3 | 4000100 | 0.002 |
| Price($) | Vol. | No. |
|---|---|---|
| 0.007 | 2536904 | 6 |
| 0.008 | 3066187 | 5 |
| 0.009 | 1057001 | 6 |
| 0.010 | 5904545 | 3 |
| 0.011 | 500000 | 1 |
| Last trade - 10.06am 03/12/2024 (20 minute delay) ? |
| NAE (ASX) Chart |


