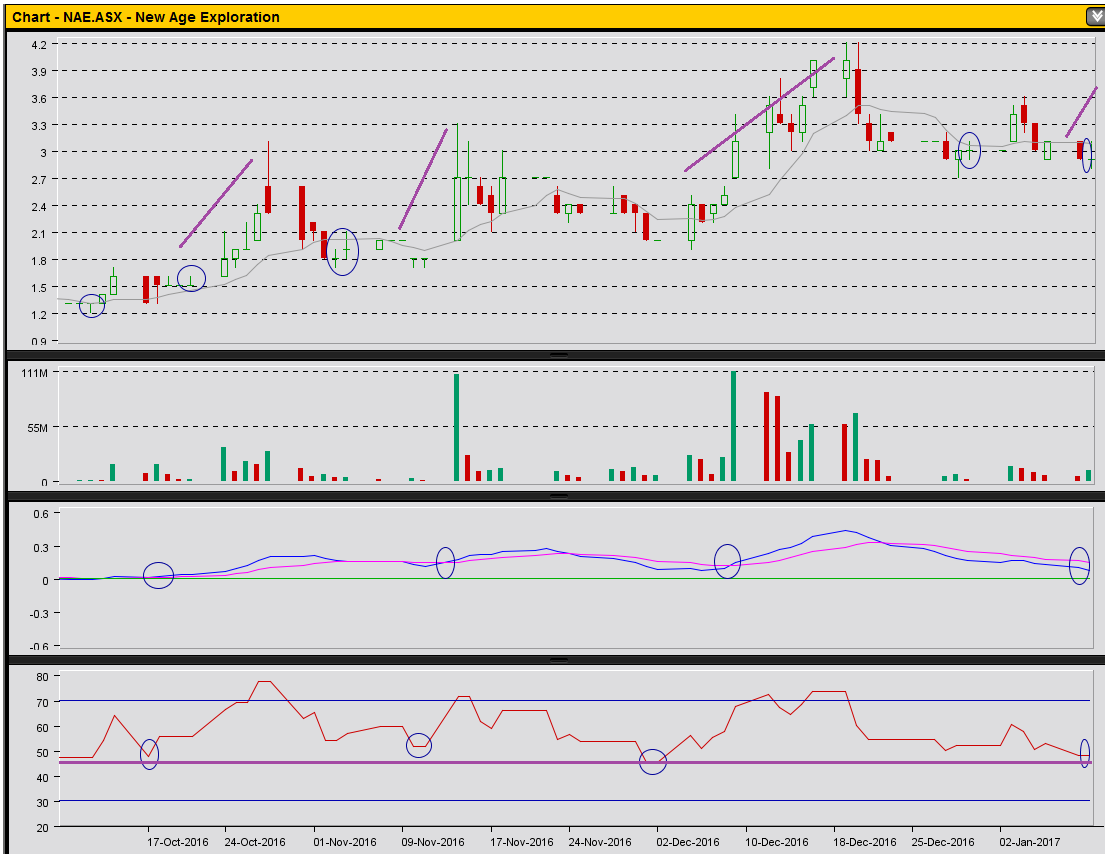
Taking a look at NAE from a TA perspective, it looks really well set up for the future.
Congrats to those who currently hold and/or bought in today - it looks like you may be rewarded IMO.
NAE finished on a Doji candlestick today suggesting a possible reverse from ST bearish to bullish. I’ve marked some previous doji patterns which are spotted shortly before its respective rally.
Today’s low also bounced nicely off the 61.8% fib retrace which was further supported by an increase in volume – buyers are starting to return.
MACD seems to be underneath the signal line looking to turn up (MACD is a lagging indicator).
Not shown on this graph (keeping it clean), the 2.8-2.9c range also represents a relatively cheap price being closer to the lower bound Bollinger line.
Lastly, the RSI shows a strong buy indication as whenever it dips sub 50, it usually has a bullish rally too.
Couple this with expected news of coking coal and gold samples for early Q1, 2017, I think the buying today has been justified.
Let's see how we go, DYOR.
- Forums
- Charts
- NAE Chart
Taking a look at NAE from a TA perspective, it looks really well...
-
- There are more pages in this discussion • 971 more messages in this thread...
You’re viewing a single post only. To view the entire thread just sign in or Join Now (FREE)
Featured News
Add NAE (ASX) to my watchlist
 (20min delay) (20min delay)
|
|||||
|
Last
0.5¢ |
Change
0.000(0.00%) |
Mkt cap ! $7.175M | |||
| Open | High | Low | Value | Volume |
| 0.0¢ | 0.0¢ | 0.0¢ | $0 | 0 |
Buyers (Bids)
| No. | Vol. | Price($) |
|---|---|---|
| 37 | 19565832 | 0.4¢ |
Sellers (Offers)
| Price($) | Vol. | No. |
|---|---|---|
| 0.5¢ | 13254057 | 10 |
View Market Depth
| No. | Vol. | Price($) |
|---|---|---|
| 2 | 2200000 | 0.006 |
| 9 | 8299899 | 0.005 |
| 6 | 3650000 | 0.004 |
| 3 | 2622888 | 0.003 |
| 3 | 4000100 | 0.002 |
| Price($) | Vol. | No. |
|---|---|---|
| 0.007 | 2536904 | 6 |
| 0.008 | 3066187 | 5 |
| 0.009 | 1057001 | 6 |
| 0.010 | 5904545 | 3 |
| 0.011 | 500000 | 1 |
| Last trade - 11.57am 04/12/2024 (20 minute delay) ? |
Featured News
| NAE (ASX) Chart |


