Posted 3charts here all different time scales.
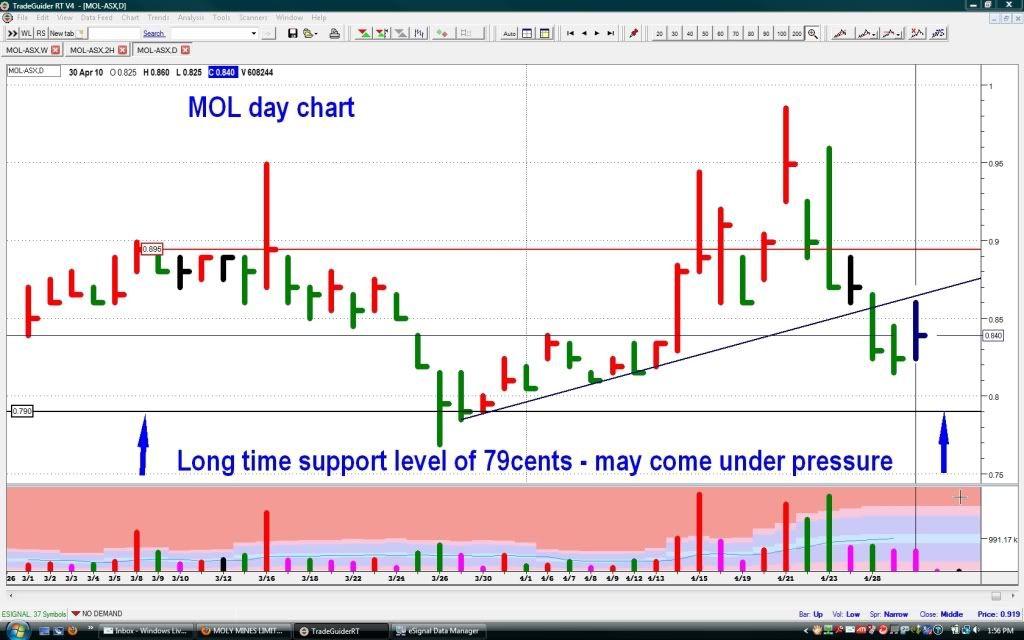
Firstly the daily - important level here imo is 79cents.

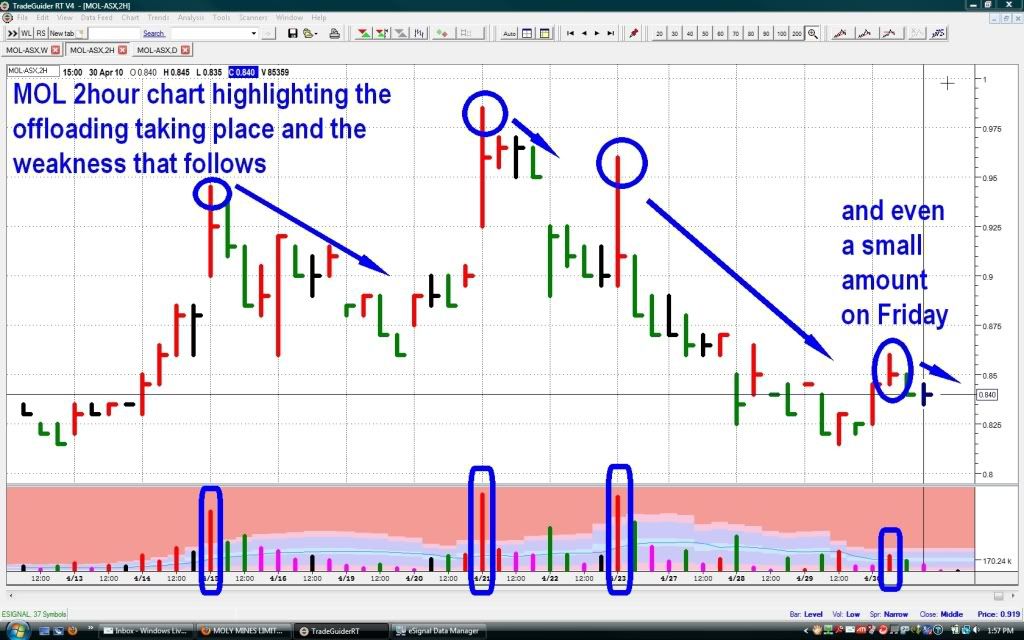
Inside the day bars this chart highlighting where the weakness is formed

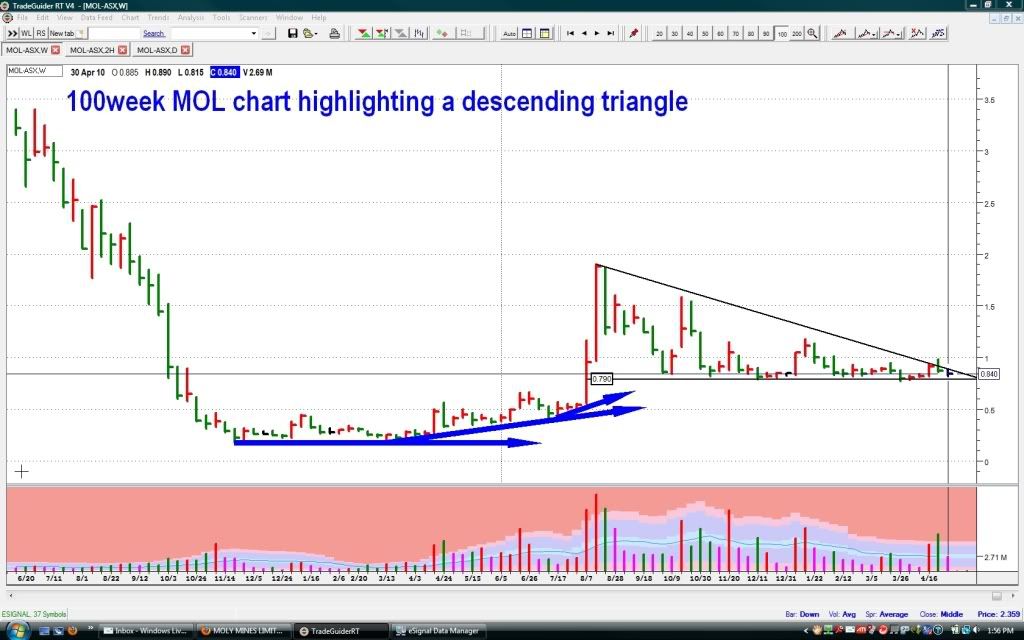
Last chart is over 100 weeks giving a longer term timeframe. Also I have cut and pasted an article on " descending triangle patterns ".

....................................
Wicked Descending Triangle
The descending triangle is consists of a falling upper trendline and a flat lower trendline. This pattern implies that bears can take the stock back down to the horizontal lower trendline support over and over again while the bulls have lost the ability to bring the stock back up to the upper resistance line (i.e. falling upper trendline).
Descending triangles materialize during a downtrend as the horizontal support level and the falling resistance level that encapsulate the consolidation zone come together. They often imply a continuation of the previous trend. Descending triangles, in a preceding uptrend, are predicted to break up and out, rather than down and out. A descending triangle gives technical traders the chance to make big profits quickly. The most common price targets are normally set to equal the entry price minus the vertical height between the two trendlines.


