- Forums
- International Markets
- january 2011
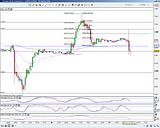
Some nice symmetry in this chart I think and stand by my thing...
-
- There are more pages in this discussion • 77 more messages in this thread...
You’re viewing a single post only. To view the entire thread just sign in or Join Now (FREE)
Add SPX (ASX) to my watchlist
 (20min delay) (20min delay)
|
|||||
|
Last
1.0¢ |
Change
-0.001(9.09%) |
Mkt cap ! $47.56M | |||
| Open | High | Low | Value | Volume |
| 1.0¢ | 1.0¢ | 0.9¢ | $49.25K | 4.933M |
Buyers (Bids)
| No. | Vol. | Price($) |
|---|---|---|
| 20 | 10613039 | 0.9¢ |
Sellers (Offers)
| Price($) | Vol. | No. |
|---|---|---|
| 1.0¢ | 482641 | 1 |
View Market Depth
| No. | Vol. | Price($) |
|---|---|---|
| 5 | 1216478 | 0.025 |
| 3 | 5220454 | 0.024 |
| 10 | 2514656 | 0.023 |
| 12 | 2865319 | 0.022 |
| 12 | 3070289 | 0.021 |
| Price($) | Vol. | No. |
|---|---|---|
| 0.026 | 3951062 | 14 |
| 0.027 | 4259673 | 17 |
| 0.028 | 3741740 | 13 |
| 0.029 | 2561634 | 8 |
| 0.030 | 6231283 | 13 |
| Last trade - 16.10pm 29/11/2024 (20 minute delay) ? |
| SPX (ASX) Chart |


