Found an interesting chart on this stock here.
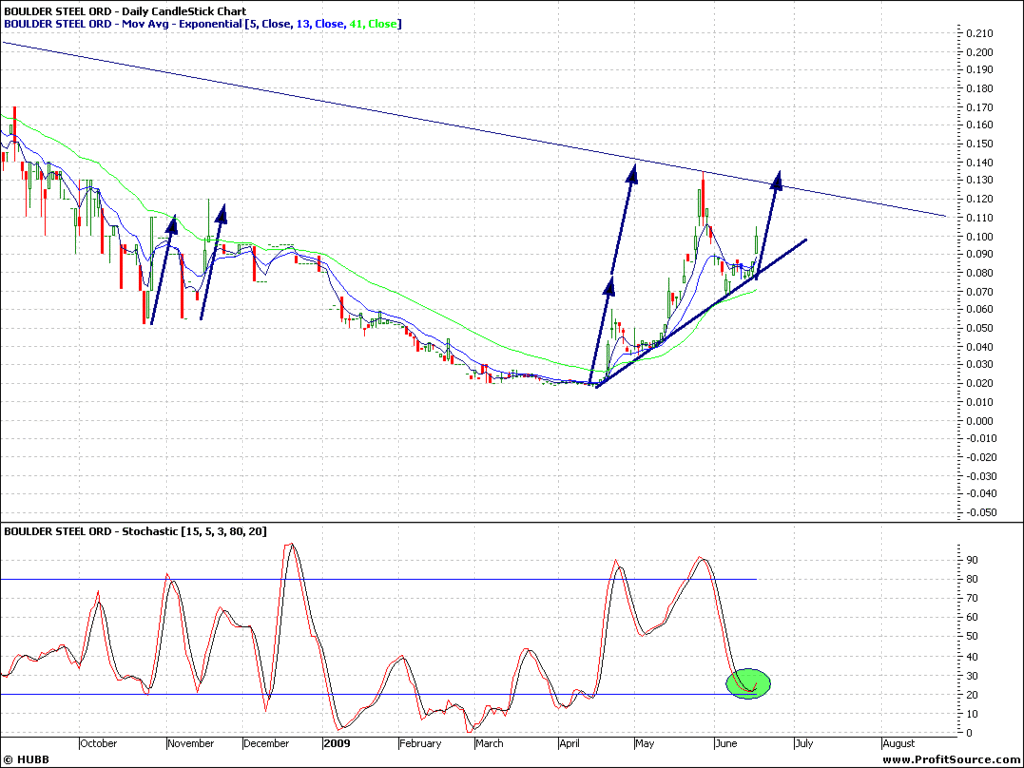
Daily:
You can see quite a few repeating speed angles here. As the share has done some consolidation, supported on the trendline, begun to rally, and the stoch is turning up, you would think the speed angle could repeat and see it back to 12.5-13 cents short term?
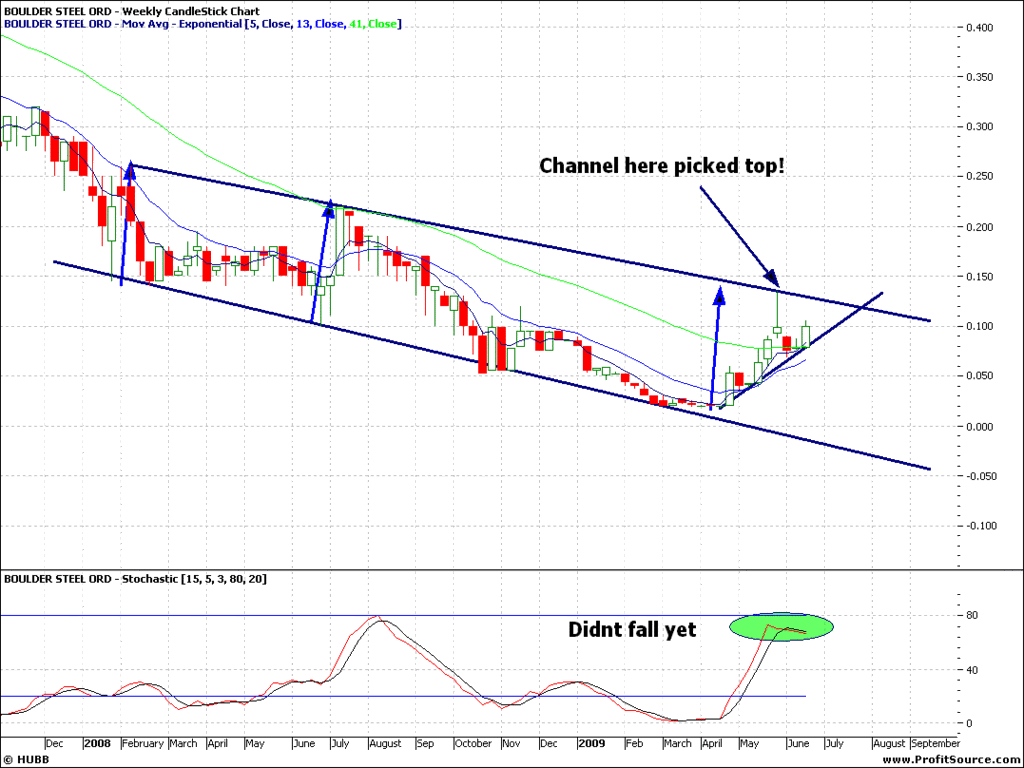
Also note the high hit resistance on the overhead trendline there? Check out weekly for this.
Weekly:
Here you can see the share is actually in a downward channel. With some nice big speed angles playing out. Last one has already repeated, as you can see the share had a blowoff top to the resistance, but the share is holding firm for now. Also the stoch hasnt fallen yet. Could see a break of the channel if the daily plays out
- Forums
- ASX - By Stock
- chart
Found an interesting chart on this stock here.Daily:You can see...
-
-
- There are more pages in this discussion • 9 more messages in this thread...
You’re viewing a single post only. To view the entire thread just sign in or Join Now (FREE)
Featured News
Add BGD (ASX) to my watchlist
The Watchlist
ACW
ACTINOGEN MEDICAL LIMITED
Andy Udell, CCO
Andy Udell
CCO
SPONSORED BY The Market Online


