On May 6th, 2017, Bitcoin hit an all-time high in transactions processed on the network in a single day: it moved 375,000 transactions which accounted for a nominal output of about $2.5b. Average fees on the Bitcoin network had climbed over a dollar for the first time a couple days prior.
And they kept climbing: by early June average fees hit an eye-watering $5.66. This was quite unprecedented. In the three-year period from Jan. 1 2014 to Jan. 1 2017, per-transaction fees had never exceeded 31 cents on a weekly average. And the hits kept coming. Before 2017 was over, average fees would top out at $48 on a weekly basis. When the crypto-recession set in, transaction count collapsed and fees crept back below $1.
During the most feverish days of the Bitcoin run-up, when normal users found themselves with balances that would cost more to send than they were worth, cries for batching — the aggregation of many outputs into a single transaction — grew louder than ever. David Harding had written a blog post on the cost-savings of batching at the end of August and it was reposted to the Bitcoin subreddit on a daily basis.
The idea was simple: for entities sending many transactions at once, clustering outputs into a single transaction was more space- (and cost-) efficient, because each transaction has a fixed data overhead. David found that if you combined 10 payments into one transaction, rather than sending them individually, you could save 75% of the block space. Essentially, batching is one way to pack as many transactions as possible into the finite block space available on Bitcoin.
When fees started climbing in mid-2017, users began to scrutinize the behavior of heavy users of the Bitcoin blockchain, to determine whether they were using block space efficiently. By and large, they were not — and an informal lobbying campaign began, in which these major users — principally exchanges — were asked to start batching transactions and be good stewards of the scarce block space at their disposal. Some exchanges had been batching for years, others relented and implemented it. The question faded from view after Bitcoin’s price collapsed in Q1 2018 from roughly $19,000 to $6000, and transaction load — and hence average fee — dropped off.
But we remained curious. A common refrain, during the collapse in on-chain usage, was that transaction count was an obfuscated method of apprehending actual usage. The idea was that transactions could encode an arbitrarily large (within reason) number of payments, and so if batching had become more and more prevalent, those payments were still occurring, just under a regime of fewer transactions.

Some sites popped up to report outputs and payments per day rather than transactions, seemingly bristling at the coverage of declining transaction count. However, no one conducted an analysis of the changing relationship between transaction count and outputs or payments. We took it upon ourselves to find out.
Table Of Contents:
- Introduction to batching
- A timeline
- Analysis
- Conclusion
- Bonus content: UTXO consolidation
1. Introduction to batching
Bitcoin uses a UTXO model, which stands for Unspent Transaction Output. In comparison, Ripple and Ethereum use an account/balance model. In bitcoin, a user has no balances, only UTXOs that they control. If they want to transfer money to someone else, their wallet selects one or more UTXOs as inputs that in sum need to add up to the amount they want to transfer. The desired amount then goes to the recipient, which is called the output, and the difference goes back to the sender, which is called change output. Each output can carry a virtually unlimited amount of value in the form of satoshis. A satoshi is a unit representing a one-hundred-millionth of a Bitcoin. This is very similar to a physical wallet full of different denominations of bills. If you’re buying a snack for $2.50 and only have a $5, you don’t hand the cashier half of your 5 dollar bill — you give him the 5 and receive some change instead.
Unknown to some, there is no hardcoded limit to the number of transactions that can fit in a block. Instead, each transaction has a certain size in megabytes and constitutes an economic incentive for miners to include it in their block. Because miners have limited space of 2 MB to sell to transactors, larger transactions (in size, not bitcoin!) will need to pay higher fees to be included. Additionally, each transaction can have a virtually unlimited number of inputs or outputs — the record stands at transactions with 20,000 inputs and 13,107 outputs.
So each transaction has at least one input and at one output, but often more, as well as some additional boilerplate stuff. Most of that space is taken up by the input (often 60% or more, because of the signature that proves they really belong to the sender), while the output(s) account for 15–30%. In order to keep transactions as small as possible and save fees, Bitcoin users have two major choices:
- Use as few inputs as possible. In order to minimize inputs, you can periodically send your smaller UTXOs to yourself in times when fees are very low, getting one large UTXO back. That is called UTXO consolidation or consolidating your inputs.
- Users who frequently make transfers (especially within the same block) can include an almost unlimited amount of outputs (to different people!) in the same transaction. That is called transaction batching. A typical single output transaction takes up 230 bytes, while a two output transaction only takes up 260 bytes, instead of 460 if you were to send them individually.
This is something that many casual commentators overlook when comparing Bitcoin with other payment systems — a Bitcoin transaction can aggregate thousands of individual economic transfers! It’s important to recognize this, as it is the source of a great deal of misunderstanding and mistaken analysis.
We’ve never encountered a common definition of a batched transaction — so for the purposes of this study we define it in the loosest possible sense: a transaction with three or more outputs. Commonly, batching is understood as an activity undertaken primarily by mining pools or exchanges who can trade off immediacy for efficiency. It is rare that a normal bitcoin user would have cause to batch, and indeed most wallets make it difficult to impossible to construct batched transactions. For everyday purposes, normal bitcoiners will likely not go to the additional effort of batching transactions.
We set the threshold at three for simplicity’s sake — a normal unbatched transaction will have one transactional output and one change output — but the typical major batched transaction from an exchange will have dozens if not hundreds of outputs. For this reason we are careful to provide data on various different batch sizes, so we could determine the prevalence of three-output transactions and colossal, 100-output ones.
We find it helpful to think of a Bitcoin transaction as a mail truck full of boxes. Each truck (transaction) contains boxes (outputs), each of which is full of some number of letters (satoshis). So when you’re looking at transaction count as a measure of the performance and economic throughput of the Bitcoin network, it’s a bit like counting mail trucks to discern how many letters are being sent on a given day, even though the number of letters can vary wildly. The truck analogy also makes it clear why many see Bitcoin as a settlement layer – just as mail trucks aren’t dispatched until they’re full, some envision that the same will ultimately be the case for Bitcoin.
 Batching
2. A timeline
So what actually happened in the last six months? Let’s look at some data. Daily transactions on the Bitcoin network rose steadily until about May 2017, when average fees hit about $4. This precipitated the first collapse in usage. Then began a series of feedback loops over the next six months in which transaction load grew, fees grew to match, and transactions dropped off. This cycle repeated itself five times over the latter half of 2017.
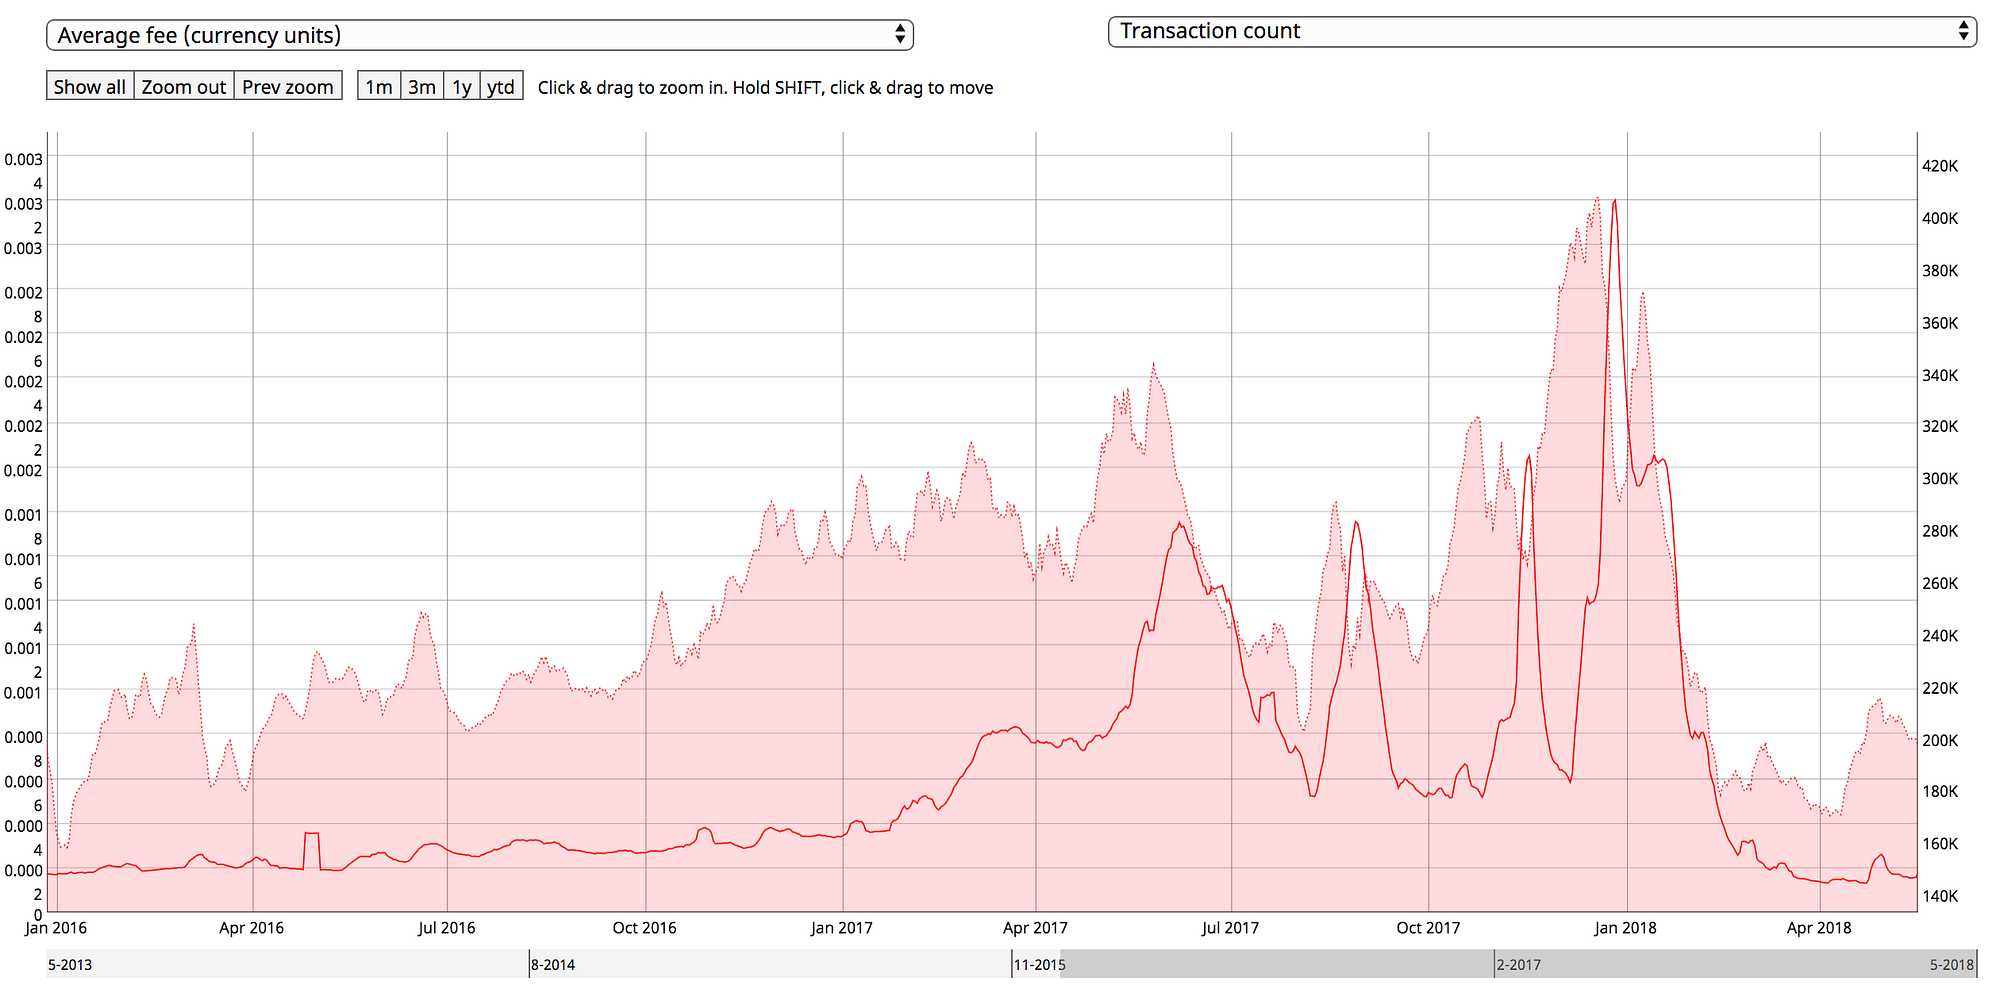
The solid red line in the above chart is fees in BTC terms (not USD) and the shaded red area is daily transaction count. You can see the cycle of transaction load precipitating higher fees which in turn cause a reduction in usage. It repeats itself five or six times before the detente in spring 2018. The most notable period was the December-January fee crisis, but fees were actually fairly typical in BTC terms — the rising BTC price in USD however meant that USD fees hit extreme figures.
In mid-November when fees hit double digits in USD terms, users began a concerted campaign to convince exchanges to be better stewards of block space. Both Segwit and batching were held up as meaningful approaches to maximize the compression of Bitcoin transactions into the finite block space available. Data on when exchanges began batching is sparse, but we collected information where it was available into a chart summarizing when exchanges began batching.
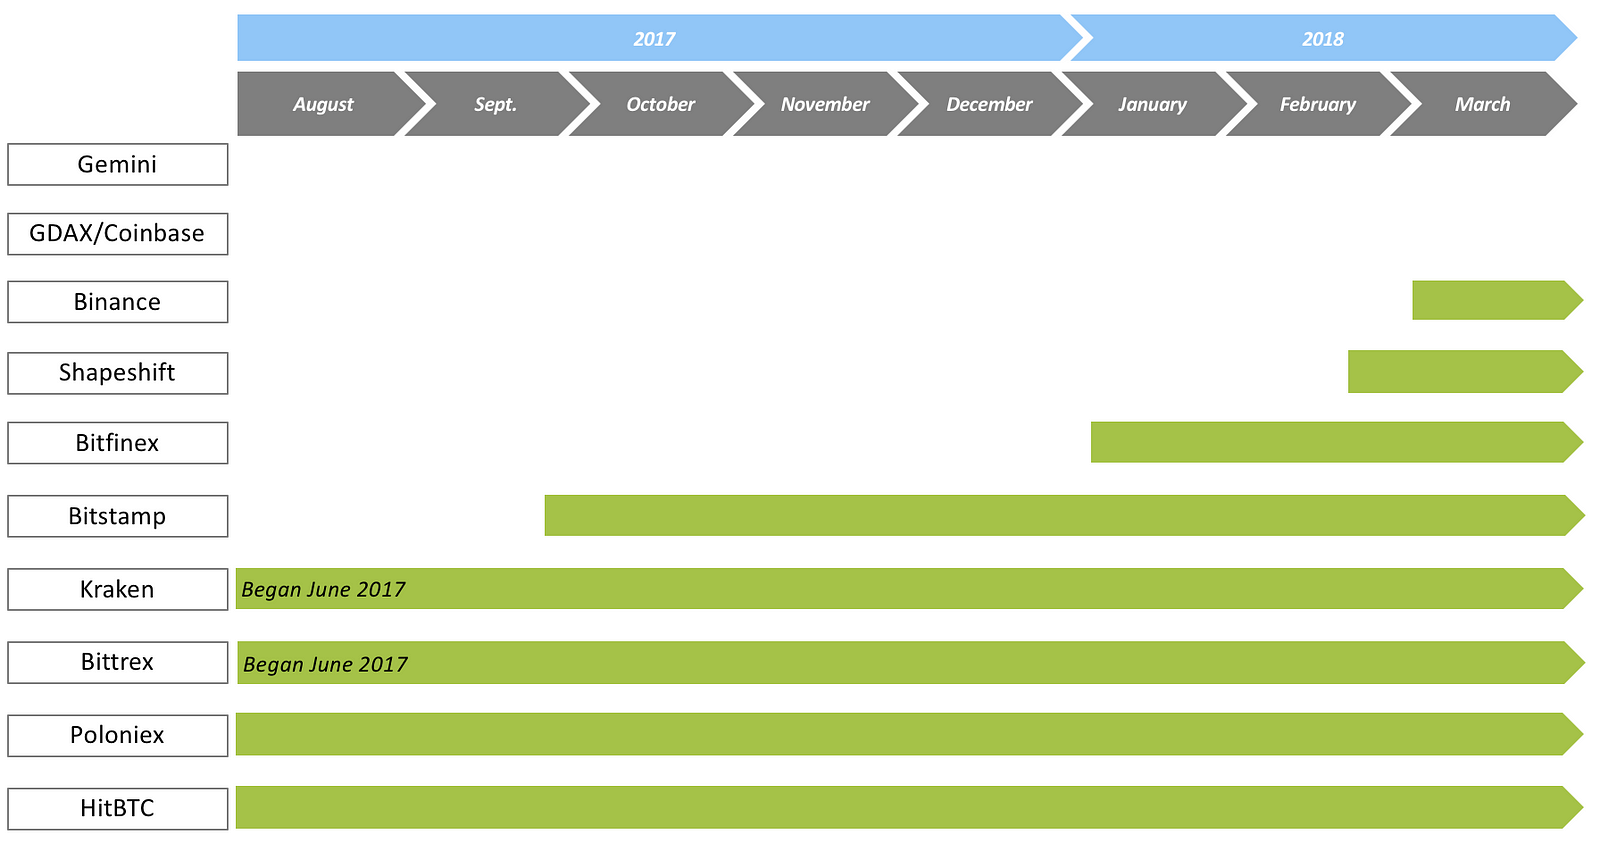 Batching adoption at selected exchanges
We’re ignoring Segwit adoption by exchanges in this analysis; as far as batching is concerned, the campaign to get exchanges to batch appears to have persuaded Bitfinex, Binance, and Shapeshift to batch. Coinbase/GDAX have stated their intention to begin batching, although they haven’t managed to integrate it yet. As far as we can tell, Gemini hasn’t mentioned batching, although we have some mixed evidence that they may have begun recently. If you know about the status of batching on Gemini or other major exchanges please get in touch.
So some exchanges have been batching all along, and some have never bothered at all. Did the subset of exchanges who flipped the switch materially affect the prevalence of batched transactions? Let’s find out.
3. Analysis
3.1 How common is batching?
We measured the prevalence of batching in three different ways, by transaction count, by output value and by output count.
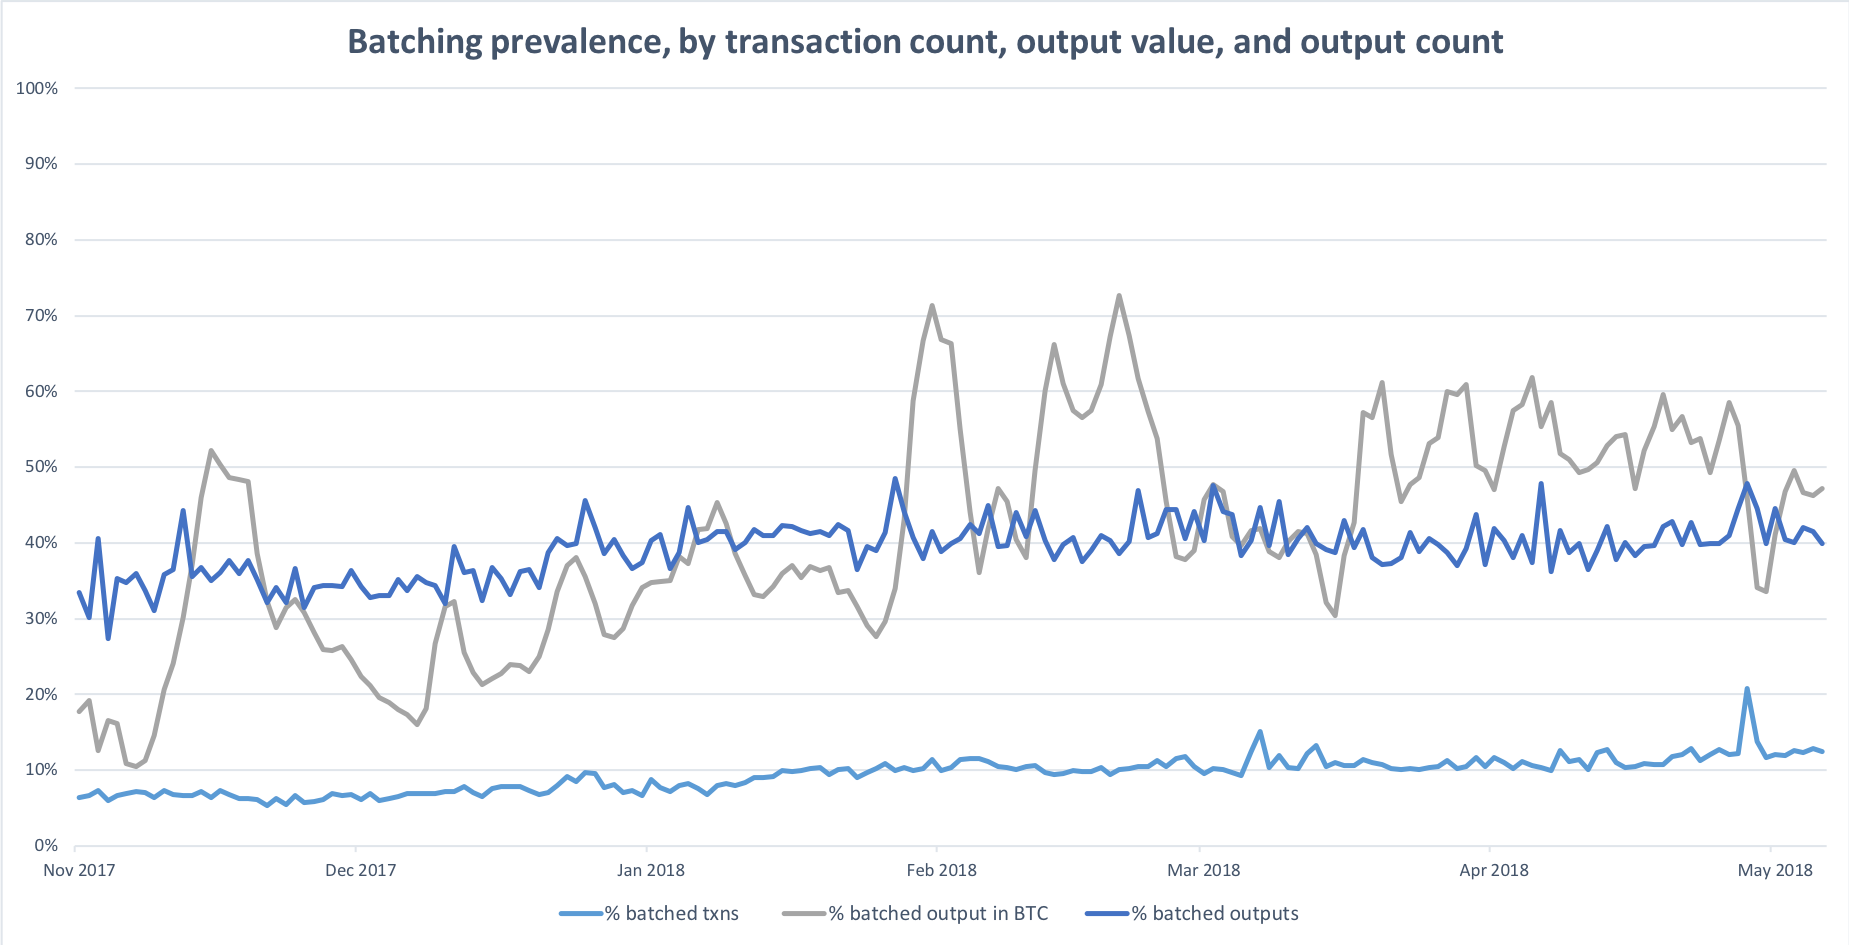 the tl;dr
Batching accounts for roughly 12% of all transactions, 40% of all outputs, and 30–60% of all raw BTC output value. Not bad.
3.2 Have batched transactions become more common over time?
From the chart in 3.1, we can already see a small, but steady uptrend in all three metrics, but we wanted to dig a little deeper. So we first looked at the relationship of payments (all outputs that actually pay someone, so total outputs minus change outputs) and transactions.
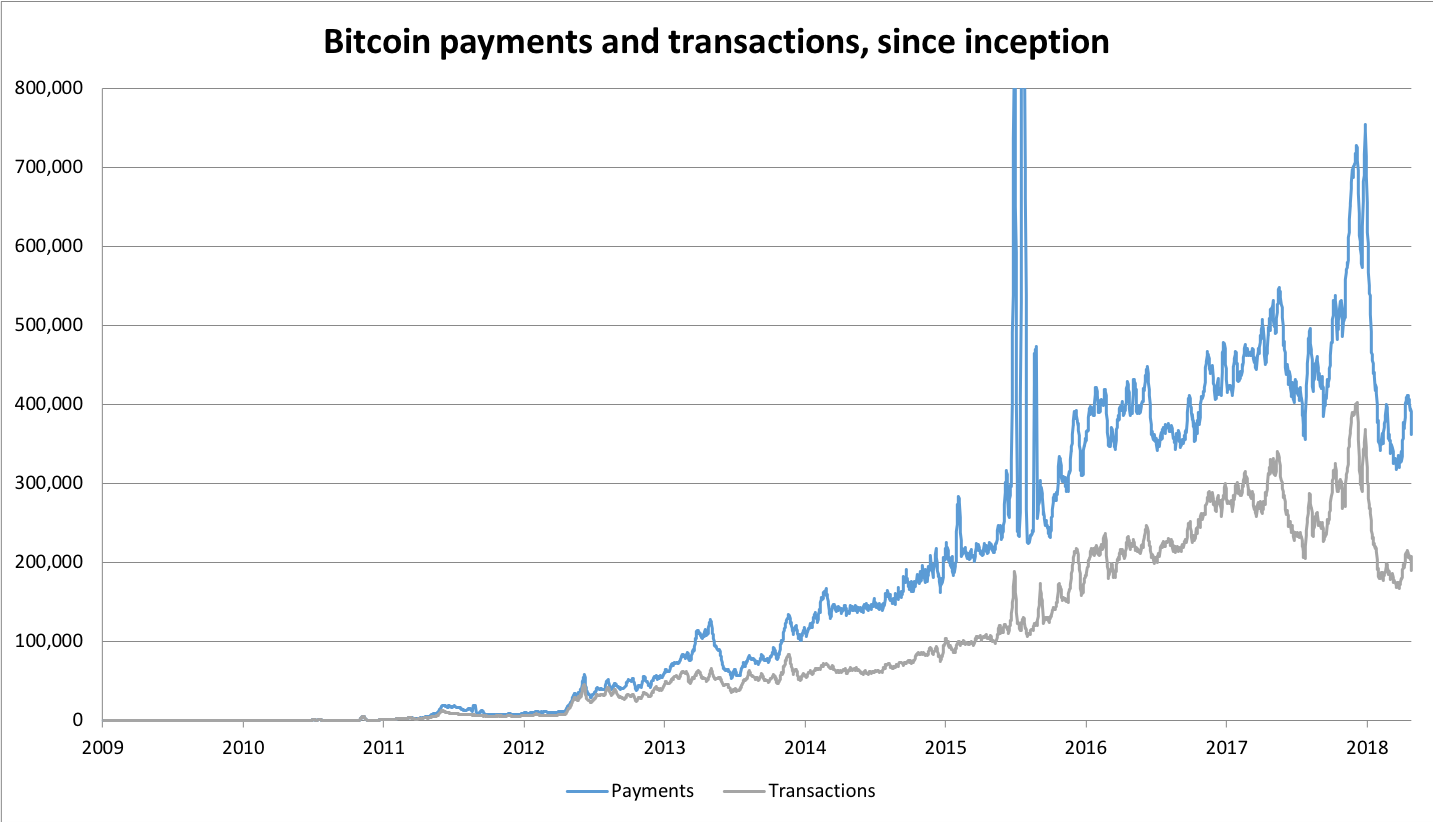 Data from transactionfee.info/charts
The first thing that becomes obvious is that the popular narrative — that the drop in transactions was caused by an increase in batching — is not the case; payments dropped by roughly the same proportion as well.
Dividing payment count by transaction count gives us some insight into the relationship between the two.
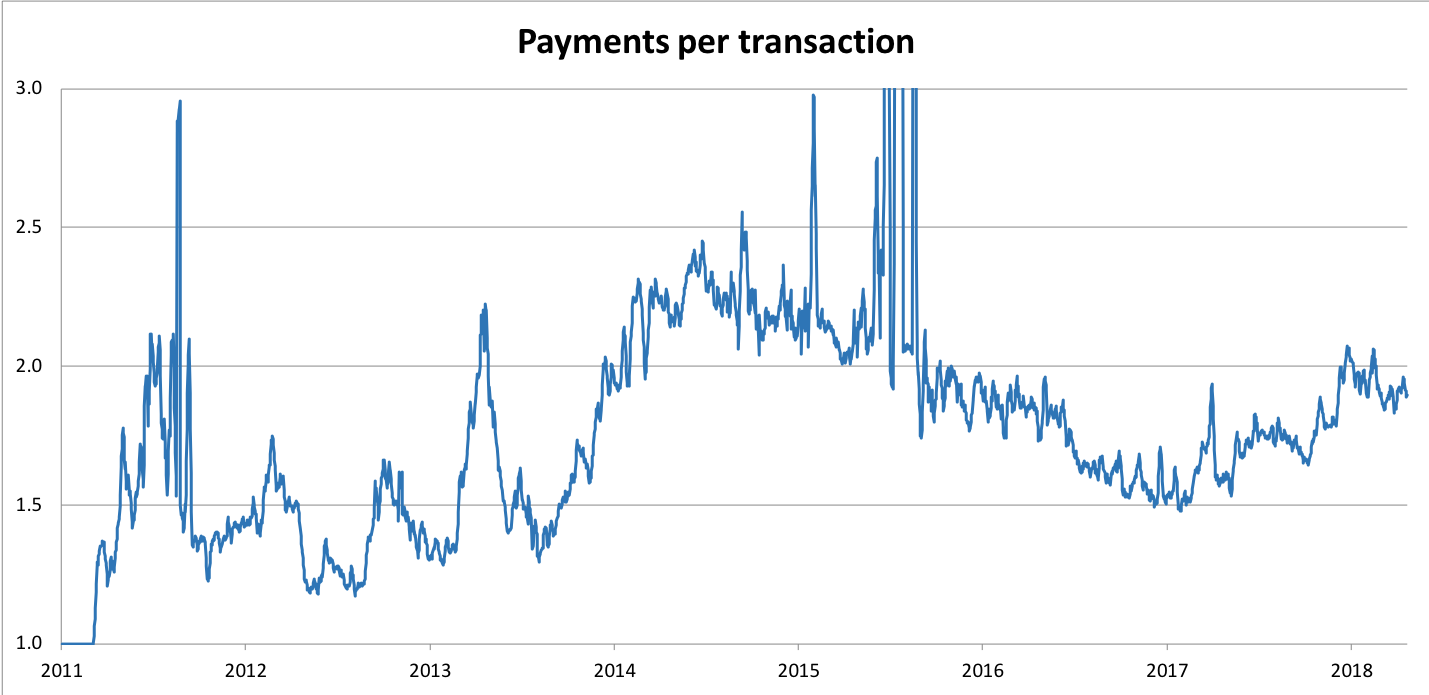
In our analysis we want to zoom into the time frame between November 2017 and today, and we can see that payments per transactions have actually been rallying, from 1.5 payments per transaction in early 2017 to almost two today.
3.3 What are popular batch sizes?
In this next part, we will look at batch sizes to see which are most popular. To determine which transactions were batched, we downloaded a dataset of all transactions on the Bitcoin network between November 2017 and May 2018 from Blockchair.
We picked that period because the fee crisis really got started in mid-November, and with it, the demands for exchanges to batch. So we wanted to capture the effect of exchanges starting to batch. Naturally a bigger sample would have been more instructive, but we were constrained in our resources, so we began with the six month sample.
We grouped transactions into “batched” and “unbatched” groups with batched transactions being those with three or more outputs.

We then divided batched transactions into roughly equal groups on the basis of how much total output in BTC they had accounted for in the six-month period. We didn’t select the batch sizes manually — we picked batch sizes that would split the sample into equal parts on the basis of transaction value. Here’s what we ended up with:

All of the batch buckets have just about the same fraction of total BTC output over the period, but they account for radically different transaction and output counts over the period. Notice that there were only 183,108 “extra large” batches (with 41 or more outputs) in the six-month period, but between them there were 23m outputs and 30m BTC worth of value transmitted.
Note that output value in this context refers to the raw or unadjusted figure — it would have been prohibitively difficult for us to adjust output for change or mixers, so we’re using the “naive” estimate.
Let’s look at how many transactions various batch sizes accounted for in the sample period:
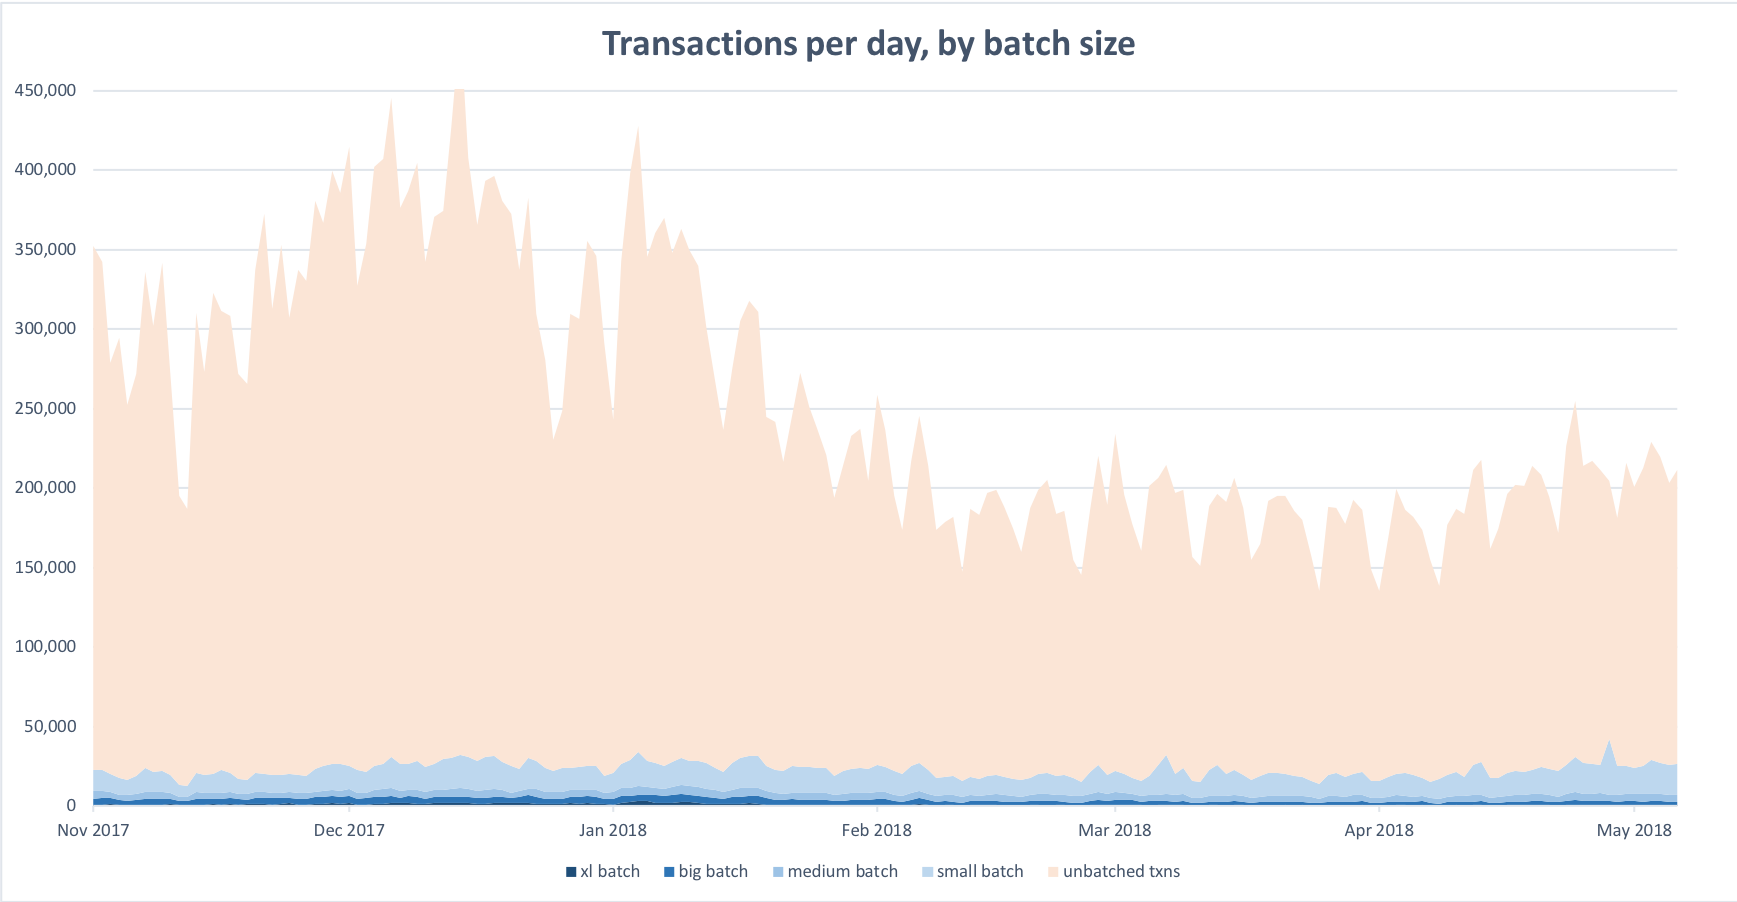
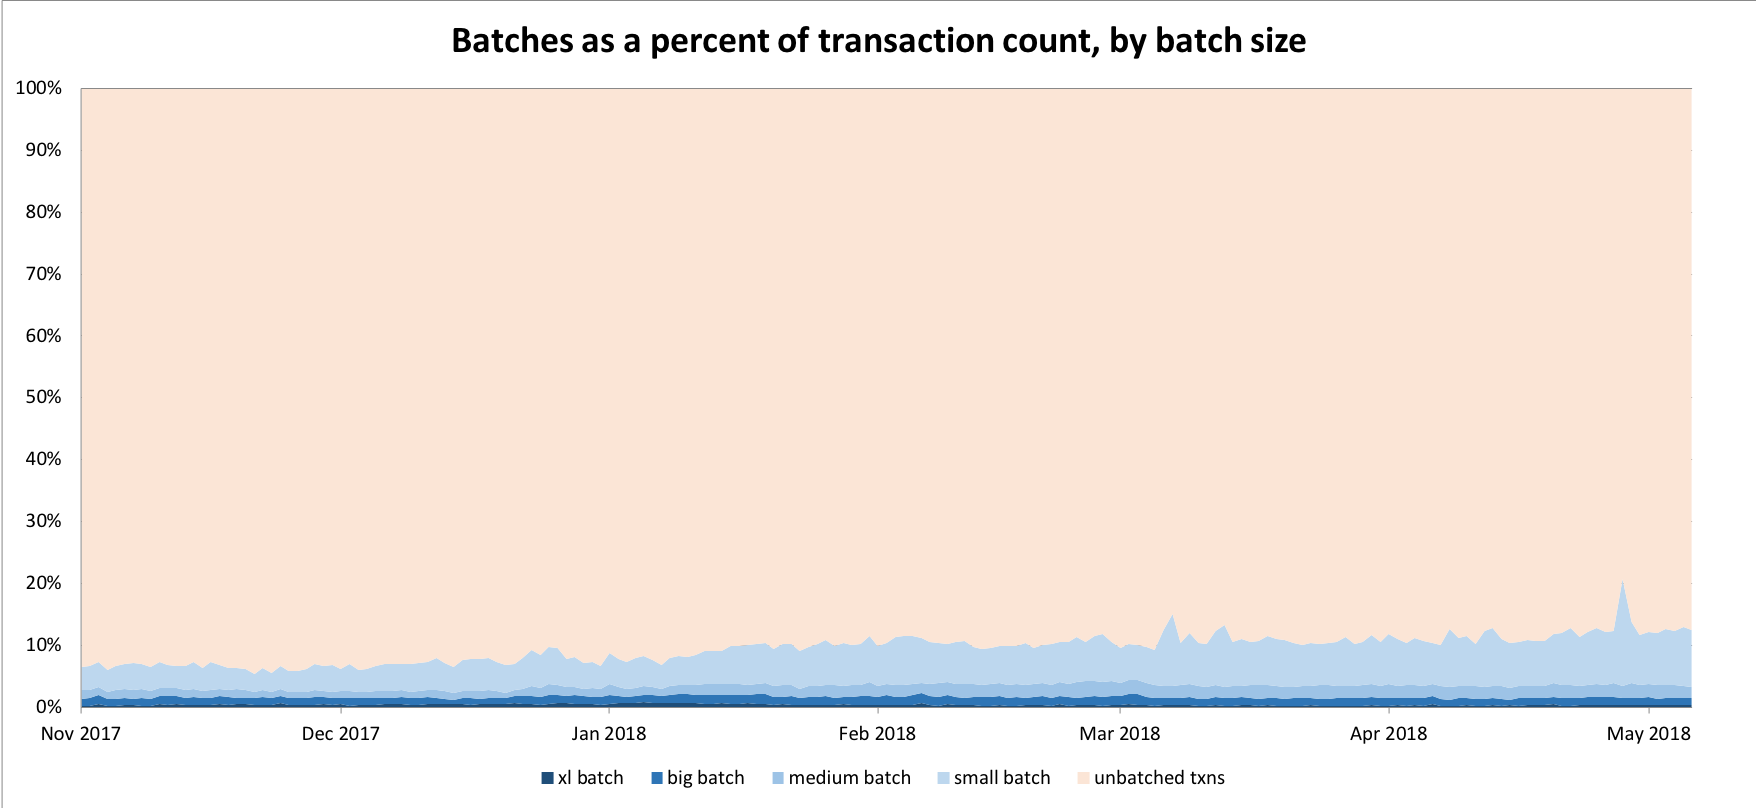
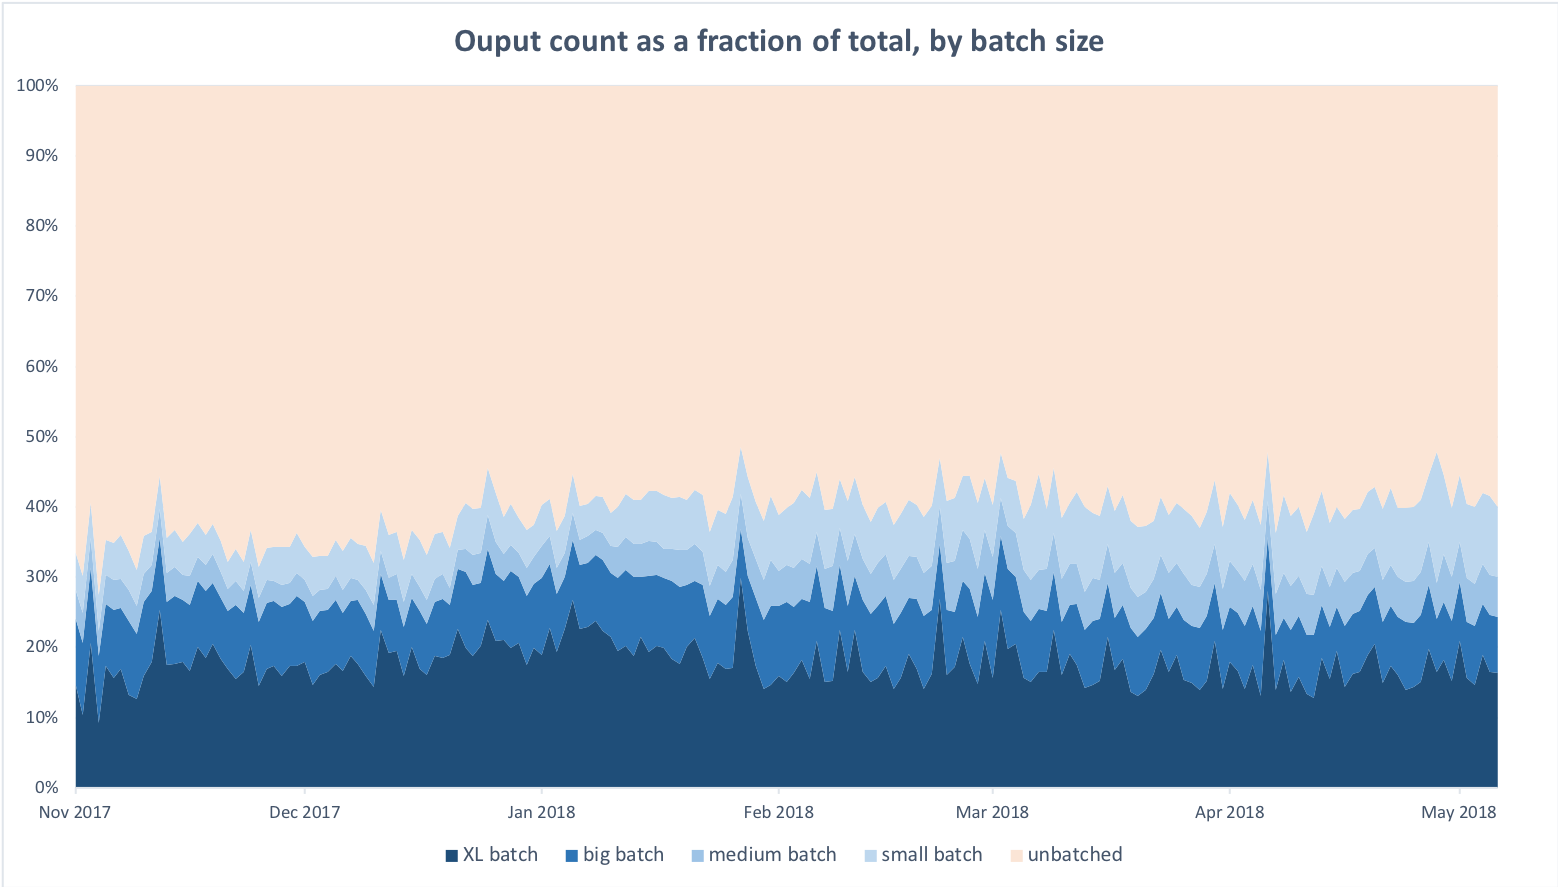
Batched transactions steadily increased relative to unbatched ones, although the biggest fraction is the small batch with between 3 and 5 outputs. The story for output counts is a bit more illuminating. Even though batched transactions are a relatively small fraction of overall transaction count, they contain a meaningful number of overall outputs. Let’s see how it breaks down:

Lastly, let’s look at output value. Here we see that batched transactions represent a significant fraction of value transmitted on Bitcoin.
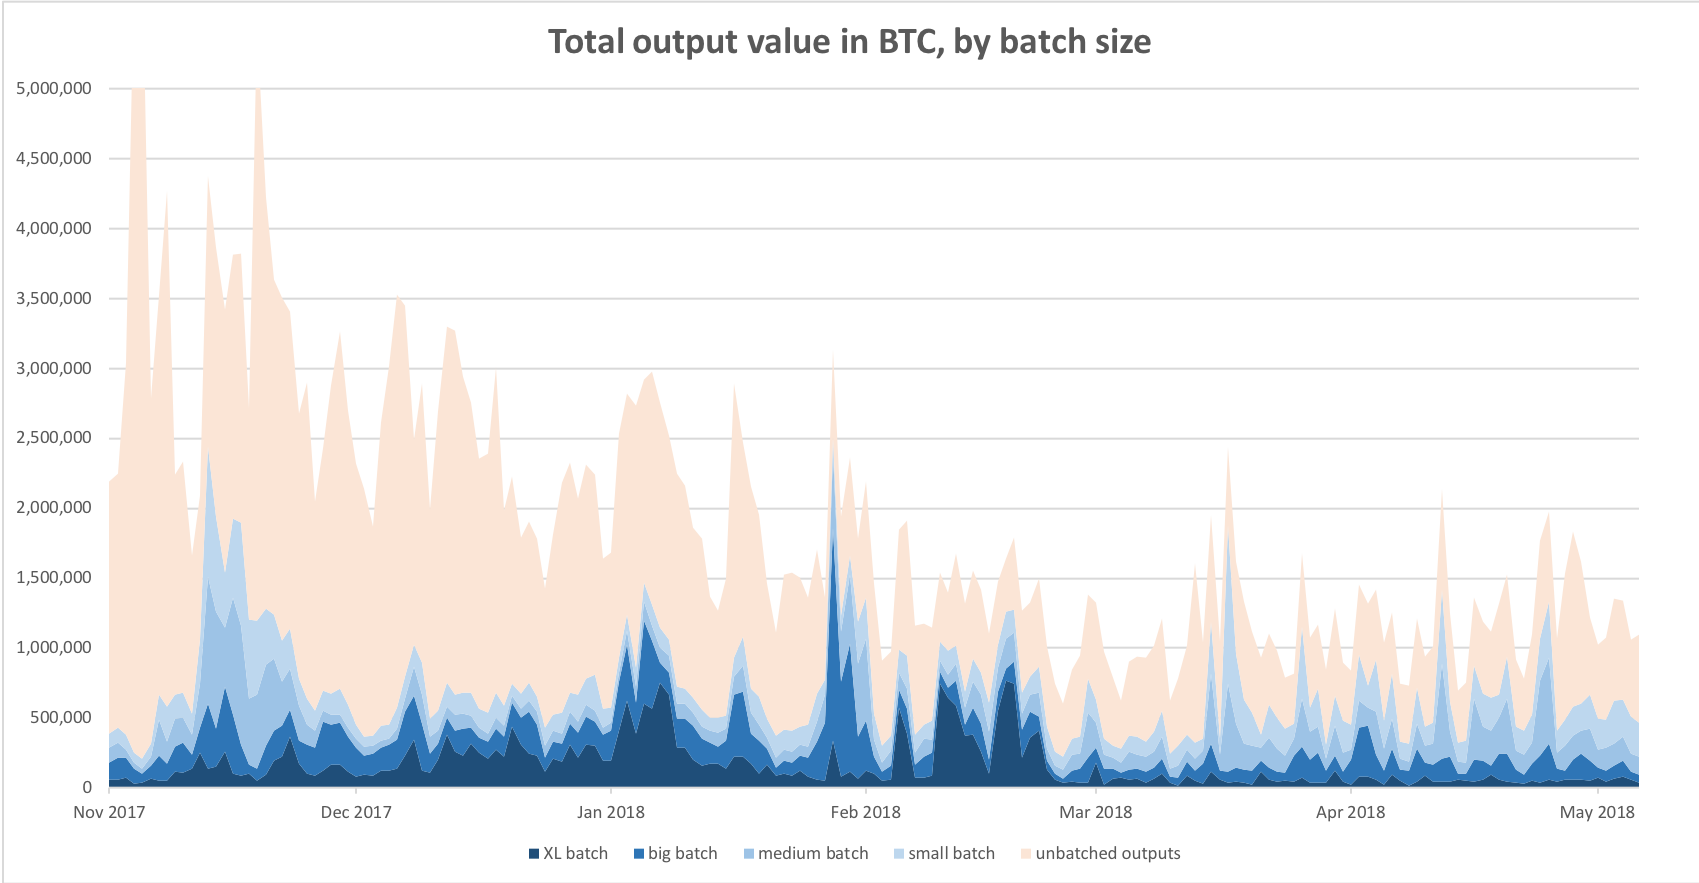
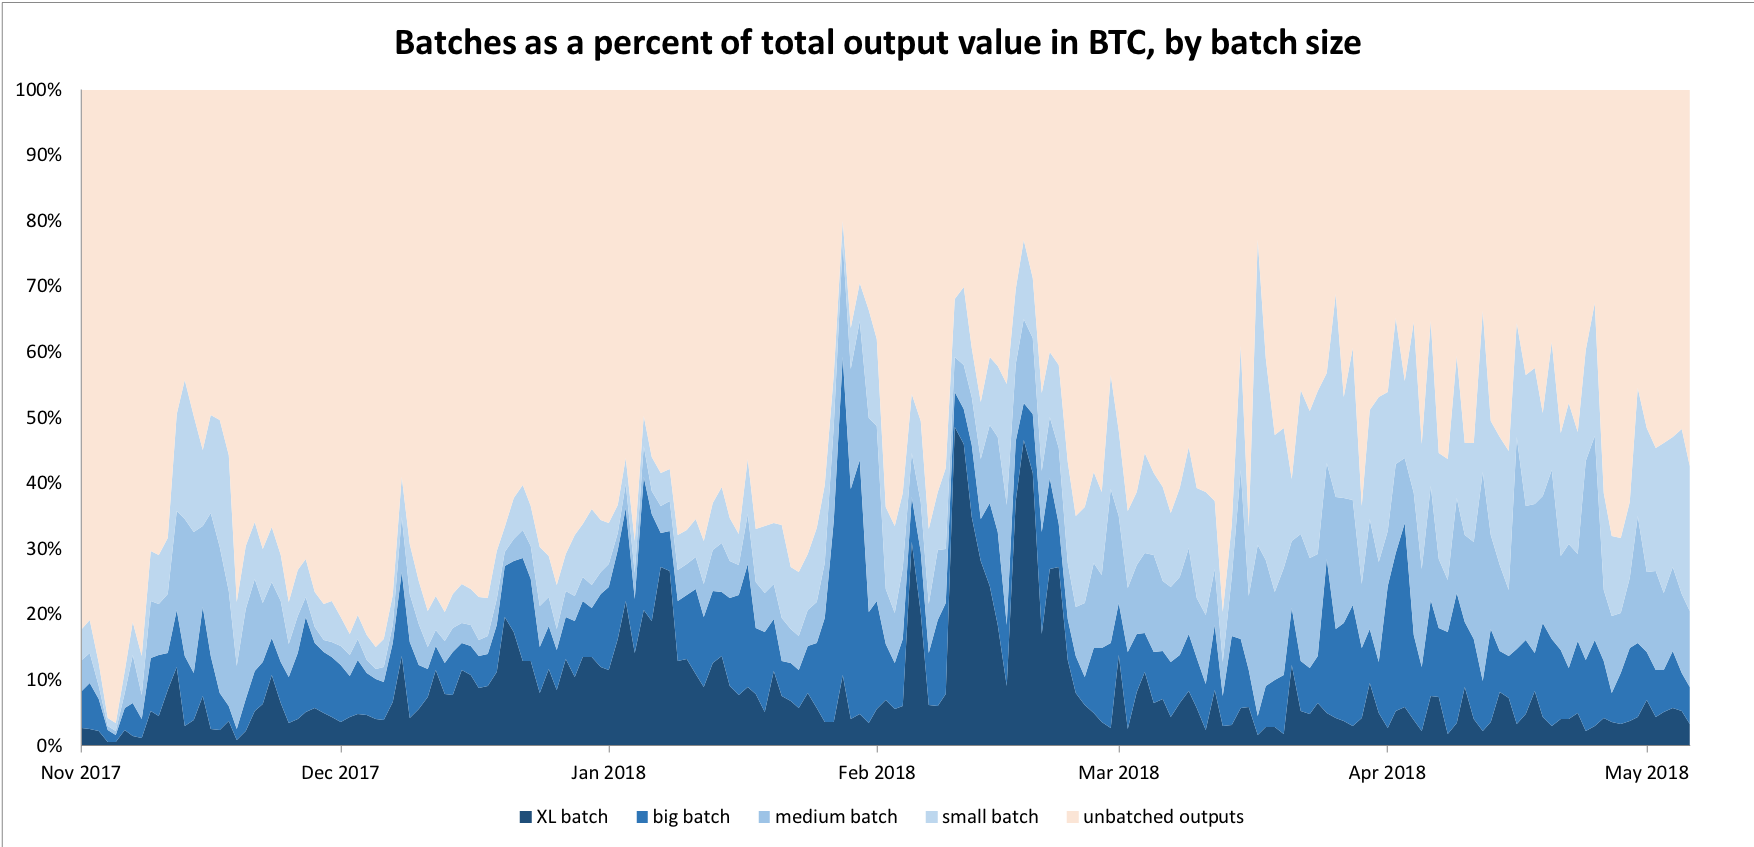
As we can see, even though batched transactions make up an average of only 12% of all transactions, they move between 30%-60% of all Bitcoins, at peak times even 70%. We think this is quite remarkable. Keep in mind, however that the ‘total output’ figure has not been altered to account for change outputs, mixers, or self-churn; that is, it is the raw and unadjusted figure. The total output value is therefore not an ideal approximation of economic volume on the Bitcoin network.
3.4 Has transaction count become an unreliable measure of Bitcoin’s usage because of batching?
Yes. We strongly encourage any analysts, investors, journalists, and developers to look past mere transaction count from now on. The default measure of Bitcoin’s performance should be “payments per day” rather than transaction count. This also makes Bitcoin more comparable with other UTXO chains. They generally have significantly variable payments-per-transaction ratios, so just using payments standardizes that. (Stay tuned: Coinmetrics will be rolling out tools to facilitate this very soon.)
More generally, we think that the economic value transmitted on the network is its most fundamental characteristic. Both the naive and the adjusted figures deserve to be considered. Adjusting raw output value is still more art than science, and best practices are still being developed. Again, Coinmetrics is actively developing open-source tools to make these adjustments available.
4. Conclusion
We started by revisiting the past year in Bitcoin and showed that while the mempool was congested, the community started looking for ways to use the blockspace more efficiently. Attention quickly fell on batching, the practice of combining multiple outputs into a single transaction, for heavy users. We showed how batching works on a technical level and when different exchanges started implementing the technique.
Today, around 12% of all transactions on the Bitcoin network are batched, and these account for about 40% of all outputs and between 30–60% of all transactional value. The fact such that a small set of transactions carries so much economic weight makes us hopeful that Bitcoin still has a lot of room to scale on the base layer, especially if usage trends continue.
Lastly, it’s worth noting that the increase in batching on the Bitcoin network may not be entirely due to deliberate action by exchanges, but rather a function of its recessionary behavior in the last few months. Since batching is generally done by large industrial players like exchanges, mixers, payment processors, and mining pools, and unbatched transactions are generally made by normal individuals, the batched/unbatched ratio is also a strong proxy for how much average users are using Bitcoin. Since the collapse in price, it is quite possible that individual usage of Bitcoin decreased while “industrial” usage remained strong. This is speculation, but one explanation for what happened.
Alternatively, the industrial players appear to be taking their role as stewards of the scarce block space more seriously. This is a significant boon to the network, and a nontrivial development in its history. If a culture of parsimony can be encouraged, Bitcoin will be able to compress more data into its block space and everyday users will continue to be able to run nodes for the foreseeable future. We view this as a very positive development. Members of the Bitcoin community that lobbied exchanges to add support for Segwit and batching should be proud of themselves.
5. Bonus content: UTXO consolidation
Remember that we said that a second way to systematically save transaction fees in the Bitcoin network was to consolidate your UTXOs when fees were low? Looking at the relationship between input count and output count allows us to spot such consolidation phases quite well.
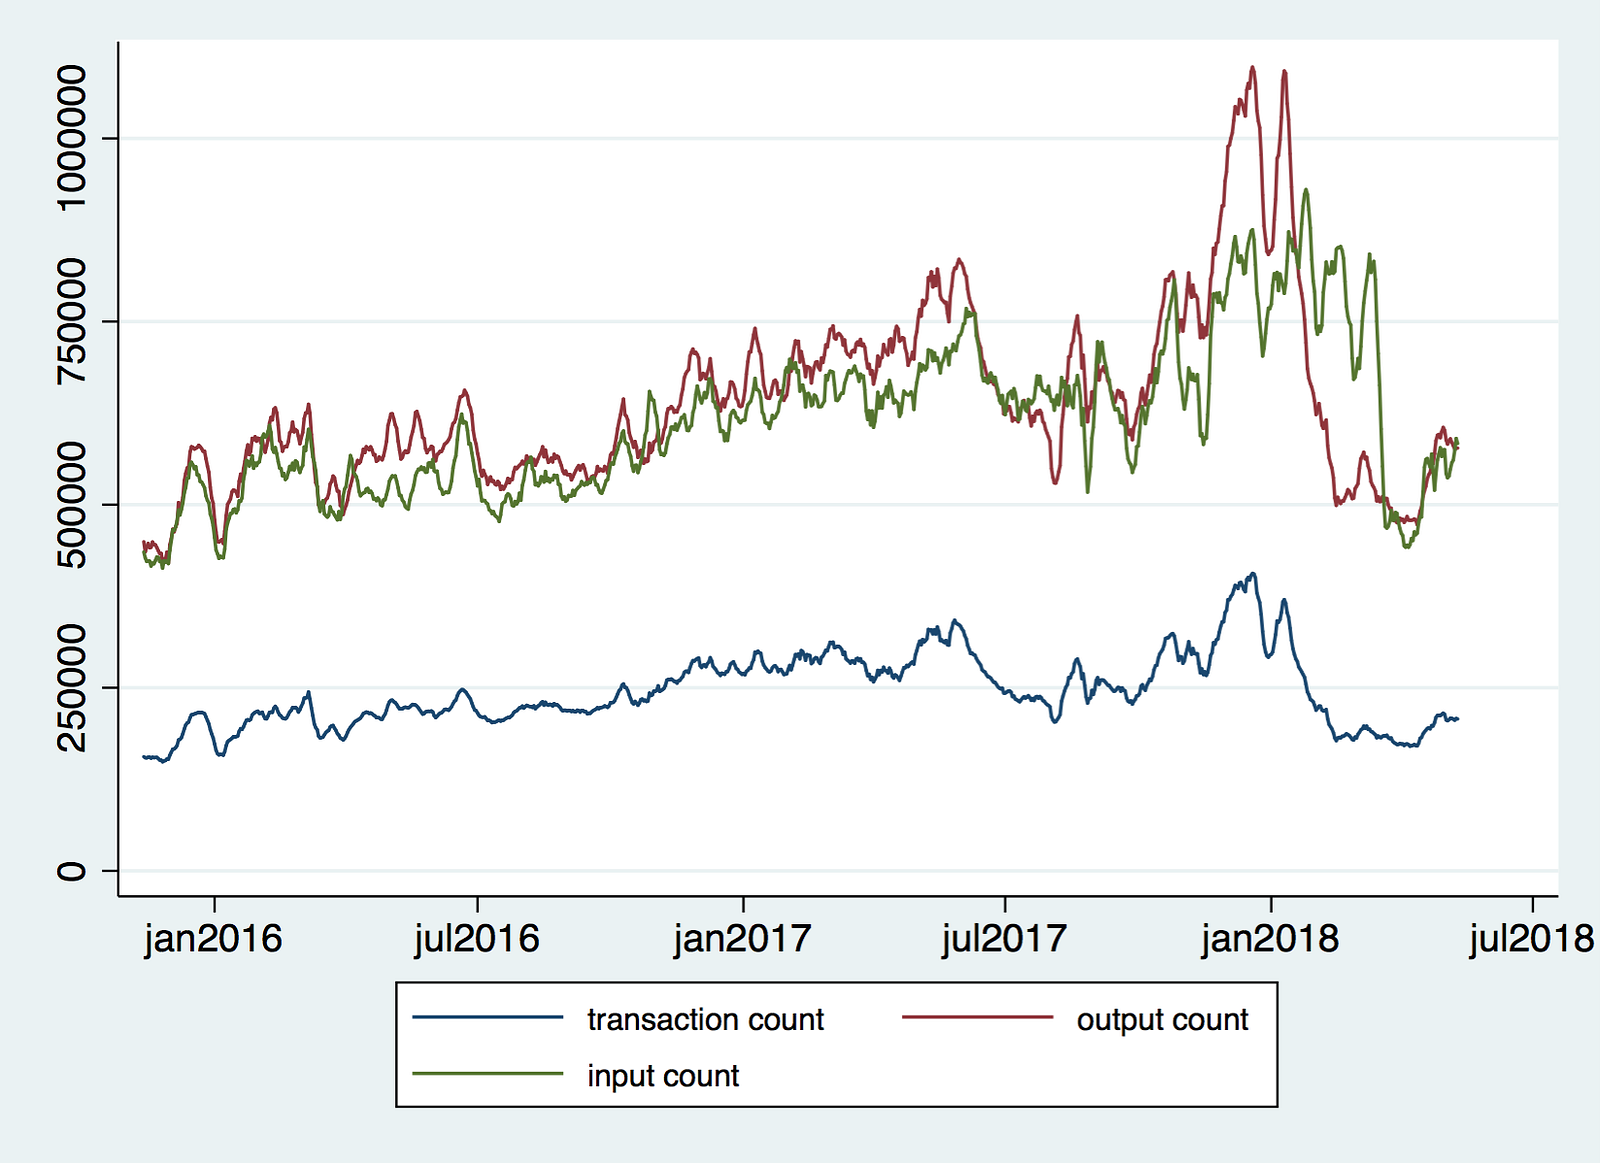
Typically, inputs and outputs move together. When the network is stressed, they decouple. If you look at the above chart carefully, you’ll notice that when transactions are elevated (and block space is at a premium), outputs outpace inputs — look at the gaps in May and December 2017. However, prolonged activity always results in fragmented UTXO sets and wallets full of dust, which need to be consolidated. For this, users often wait until pressure on the network has decreased and fees are lower. Thus, after transactions decrease, inputs become more common than outputs. You can see this clearly in February/March 2018.
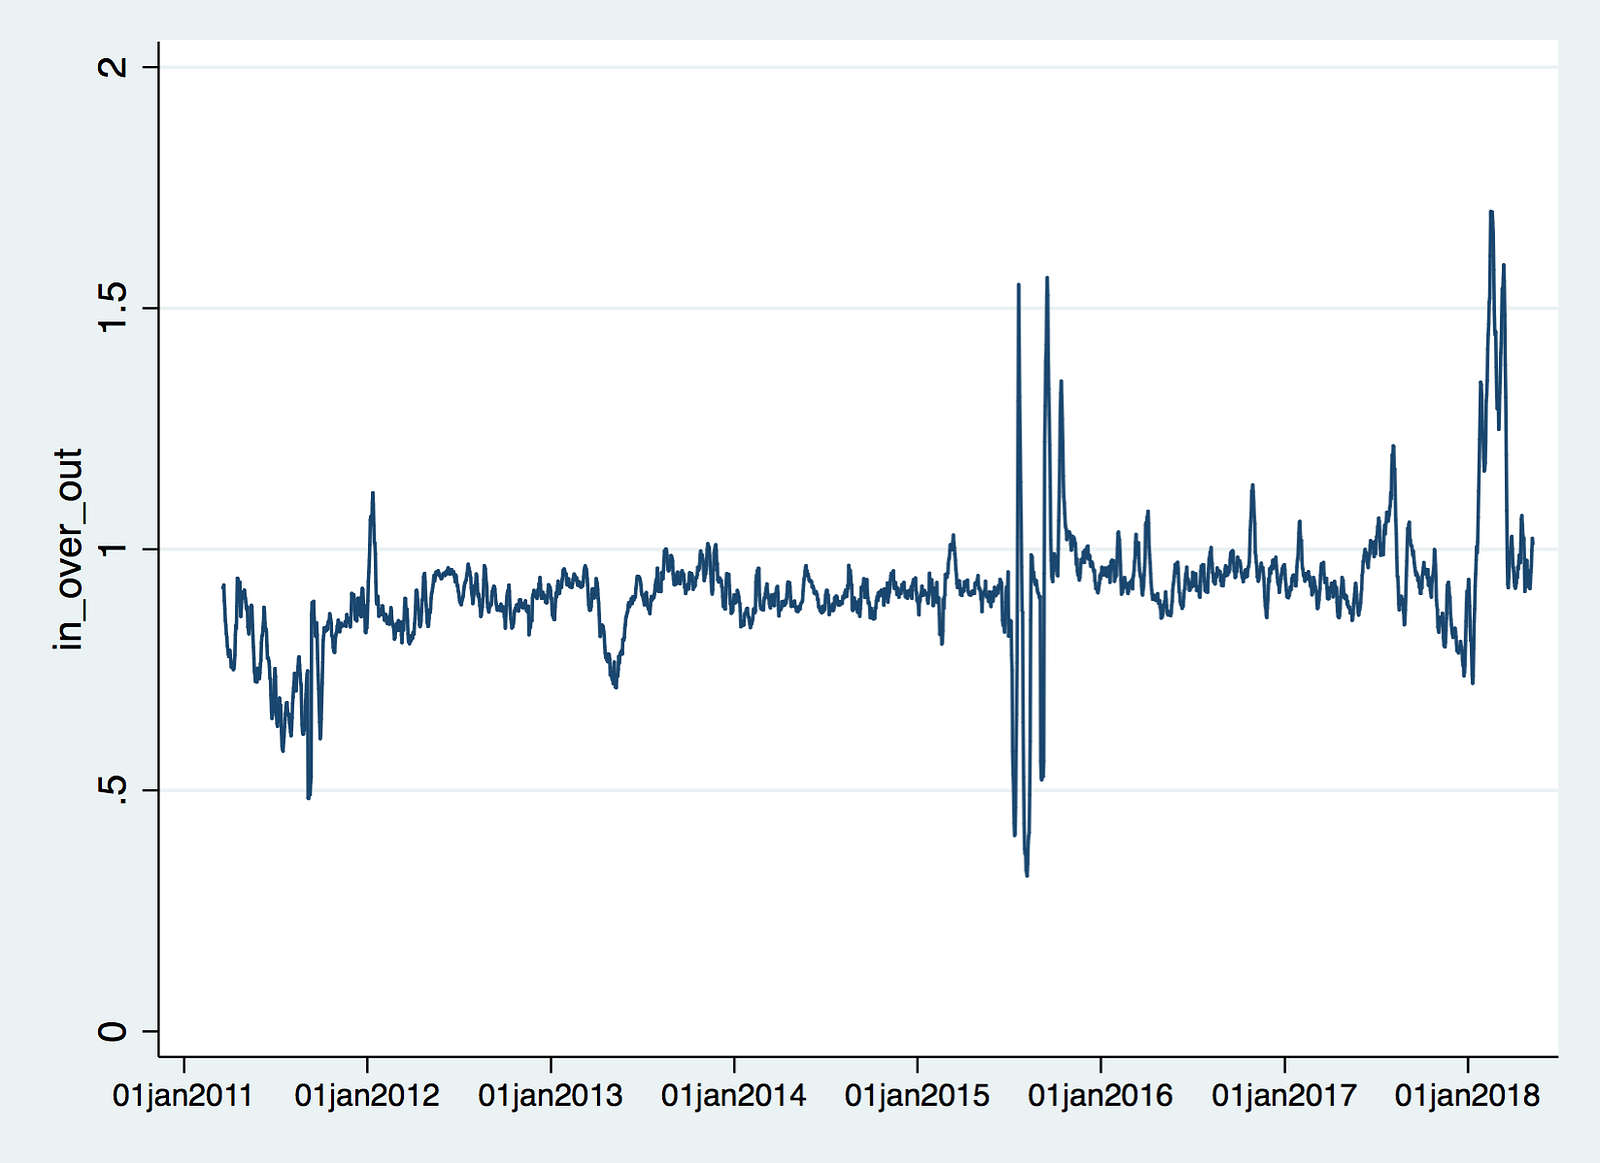
Here we’ve taken the ratio of inputs to outputs (which have been smoothed on a trailing 7 day basis). When the ratio is higher, there are more inputs than outputs on that day, and vice versa. You can clearly see the spam attack in summer 2015 in which thousands (possibly millions) of outputs were created and then consolidated. Once the ratio spikes upwards, that’s consolidation. The spike in February 2018 after the six weeks of high fees in December 2017 was the most pronounced sigh of relief in Bitcoin’s history; the largest ever departure from the in/out ratio norm. There were a huge number of UTXOs to be consolidated.
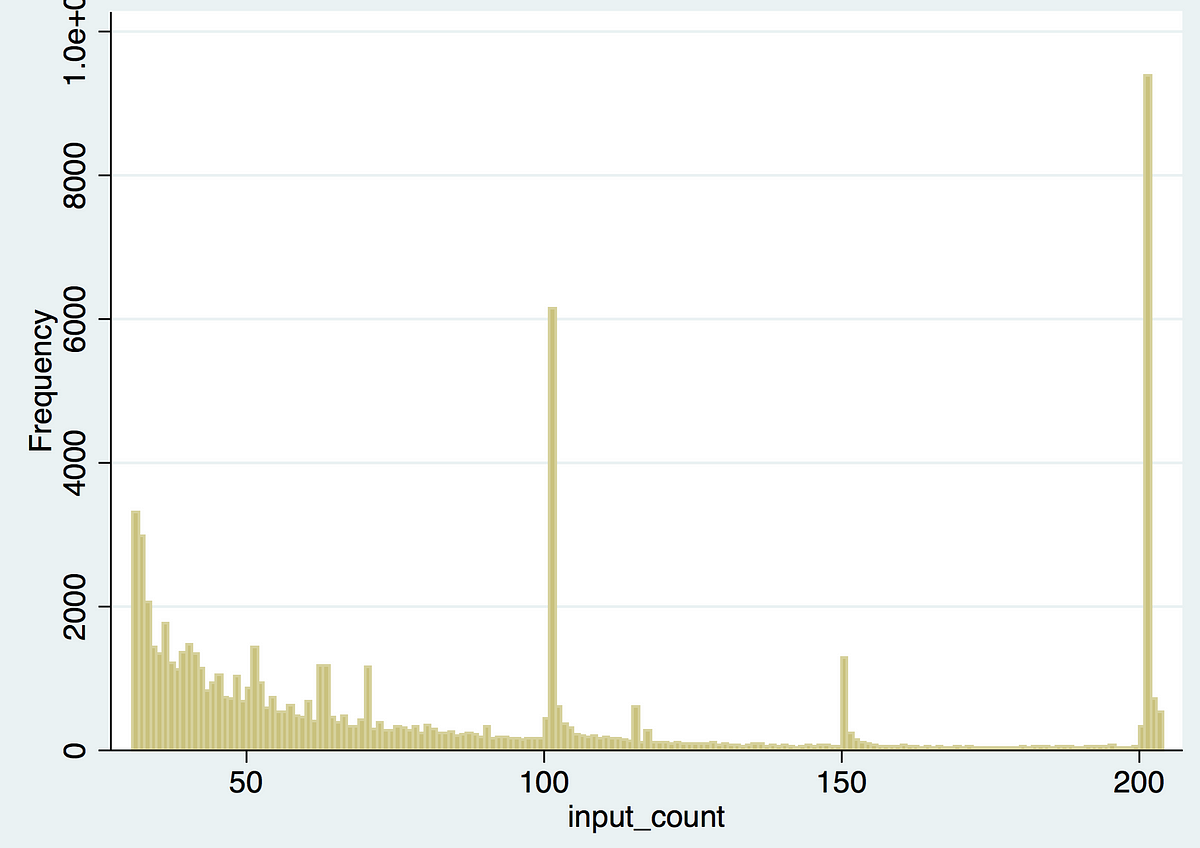
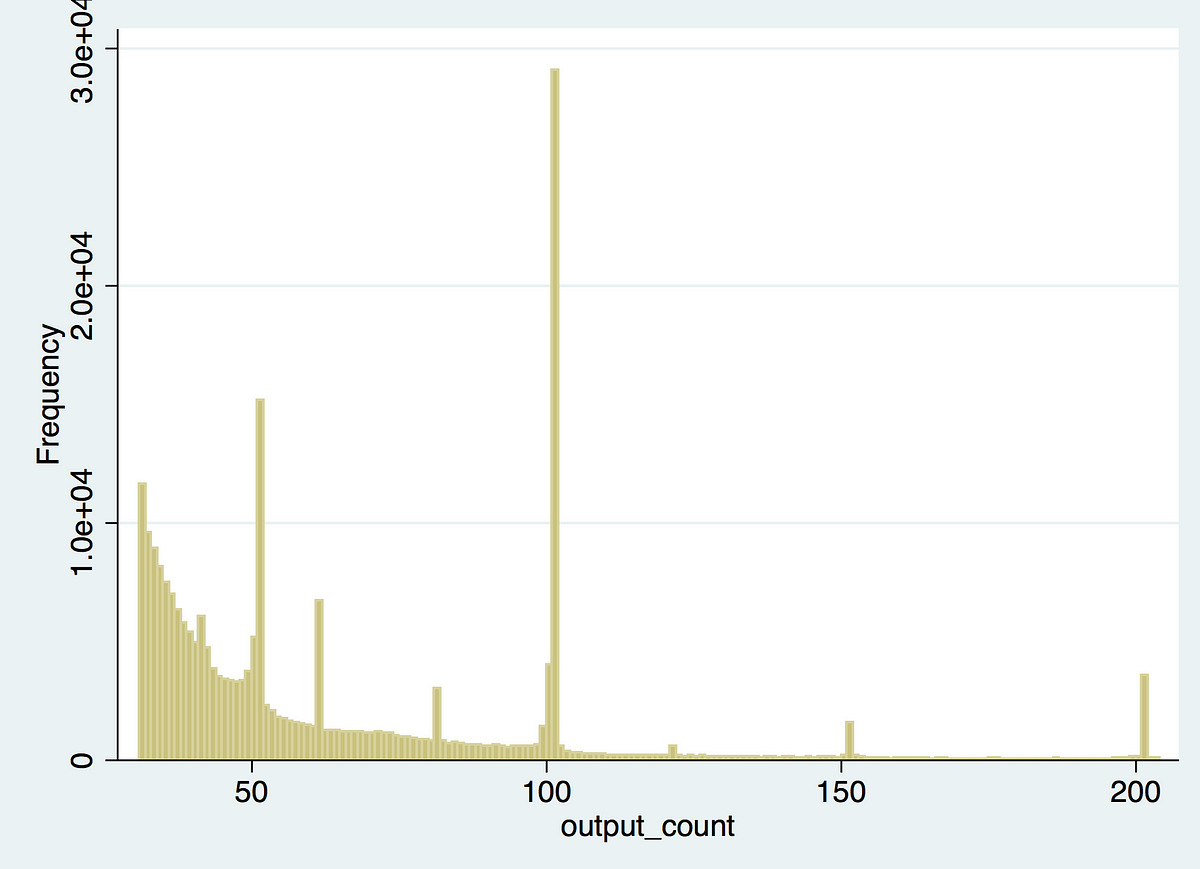
It’s also interesting to note where inputs and outputs cluster. Here we have histograms of transactions with large numbers of inputs or outputs. Unsurprisingly, round numbers are common which shows that exchanges don’t publish a transaction every, say, two minutes, but instead wait for 100 or 200 outputs to queue up and then publish their transaction. Curiously, 200-input transactions were more popular than 100-input transactions in the period.
We ran into more curiosities when researching this piece, but we’ll leave those for another time.
Future work on batching might focus on:
- Determining batched transactions as a portion of (adjusted) economic rather than raw volume
- Looking at the behavior of specific exchanges with regards to batching
- Investigating how much space and fees could be saved if major exchanges were batching transactions
Lastly, we encourage everyone to run their transactions through the service at transactionfee.info to assess the efficiency of their transactions and determine whether exchanges are being good stewards of the block space.
Update: see a full implementation of our methodology at p2sh.info.
* * *
We’d like to thank 0xB10C for their generous assistance with datasets and advice, the people at Blockchair for providing the core datasets, and David A. Harding for writing the initial piece and answering our questions.
This blog post was written by Nic Carter and @hasufly.


