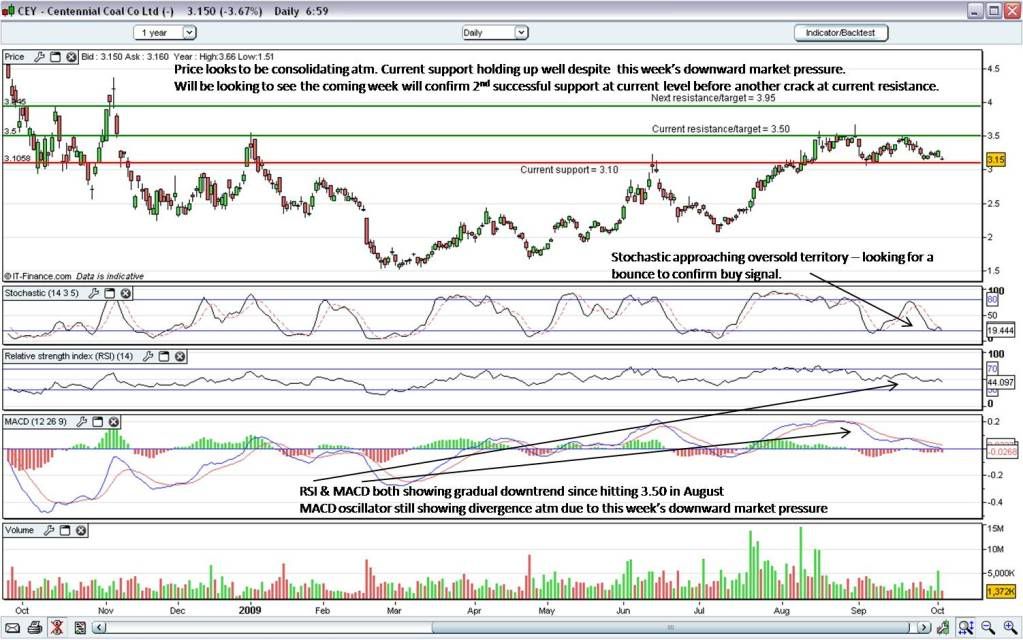
Hi All, please see below an updated daily chart on CEY:
CEY has shown a steady increase in price since bottoming in March, based on solid fundamentals derived both from the current trend in the coal sector as well as the company's financial position.
It currently appears to be showing some consolidation just above the current support level of around 3.10, which imo provides a good risk return ratio entry for a ST trade, while CEY still represents good value for the longer term not having shown over-the-top buying interest as many other stocks have shown of late. The stochastic is approaching oversold territory, which is indicating confirmation of support for the 3.10 level.
The MACD and RSI are both showing gradual downtrend, which will require them to break out of that pattern if another strong move for and breakthroug of resistance at 3.50 is to occur.
Nevertheless, given how close the price is now to short term support, a low risk entry is indicated at 3.10-3.15, with a stop at 3.05 and target of 3.50, making a rrr of 0.35/0.10 = 3.5, if using 3.15 as the entry point.
Anyway, good luck to all holders, Sharks.
- Forums
- ASX - By Stock
- CEY
- cey chart
cey chart
-
- There are more pages in this discussion • 6 more messages in this thread...
You’re viewing a single post only. To view the entire thread just sign in or Join Now (FREE)


