https://www.investing.com/analysis/week-ahead-200349551
Week Ahead: U.S. Equities, Oil To Test Uptrend; Bearish USD Could Boost Gold
- Most US indices finish the week lower
- Earnings beats pressured by lowest home sales since 2015
- Is credit crunch creating a financial crisis, hurting the dollar?
Most US stocks and indices including the S&P 500, NASDAQ Composite and Russell 2000, closed lower on Friday, as solid corporate earnings were severely pressured by weak housing data after existing home sales seriously disappointed, dropping 3.4 percent in August to their lowest level since November 2015. There was also a psychological factor driving volatility, the 31st anniversary of 'Black Monday,' when, on Monday October 19, 1987, global equity markets crashed.
While analysts continue to debate whether the current selloff is the beginning of a deeper correction or merely a buying opportunity, for many experienced traders and investors, a dark cloud hovers over the month of October. During the 1987 collapse, the Dow lost 508 points in just one day, making it among the worst single-day performances in stock market history.
Indices Slip But Defensive Sectors Shine
Stocks initially rose on Friday, with early reports beating estimates. PayPal (NASDAQ:PYPL) jumped 9.4 percent after the company beat on both earnings and revenue and boosted its outlook. Proctor & Gamble (NYSE:PG) surged 8.8 percent thanks to the best quarterly sales figures since 2013. American Express (NYSE:AXP) rose 3.8 percent after beating expectations and revising guidance upwards.
Some stocks, however, offset the gains. eBay (EBAY) dropped 8.9 percent to its lowest since December 2016 after Stifel Nicolaus downgraded its shares from buy to hold. DowDuPont (NYSE:DWDP) tumbled 1.9 percent after after the company cut the asset value of its agricultural business by $4.6 billion. American International Group (NYSE:AIG) slumped 2.9 percent after announcing it will likely post quarterly catastrophic losses of as much as $1.7 billion from such natural disasters as Hurricane Florence in the US and typhoons Jebi and Trami in Asia.
Overall, the S&P 500 Index edged down only slightly to finish the week, off 0.04 percent. However it was the third straight day of declines for the benchmark. Nevertheless, it was propped up for the second day by its 200 DMA as well as the bottom of a still-forming bearish rising flag, right above the uptrend line since the February 2016 bottom.
Defensive sectors Consumer Staples (+2.28 Friday and +4.41 percent weekly) and Utilities (+1.56 percent Friday and +3.06 for the week) outshone, while risk sectors Consumer Discretionary (-0.98 percent Friday and 1.97 percent weekly) led the losses, underscoring the risk-off attitude investors have assumed.
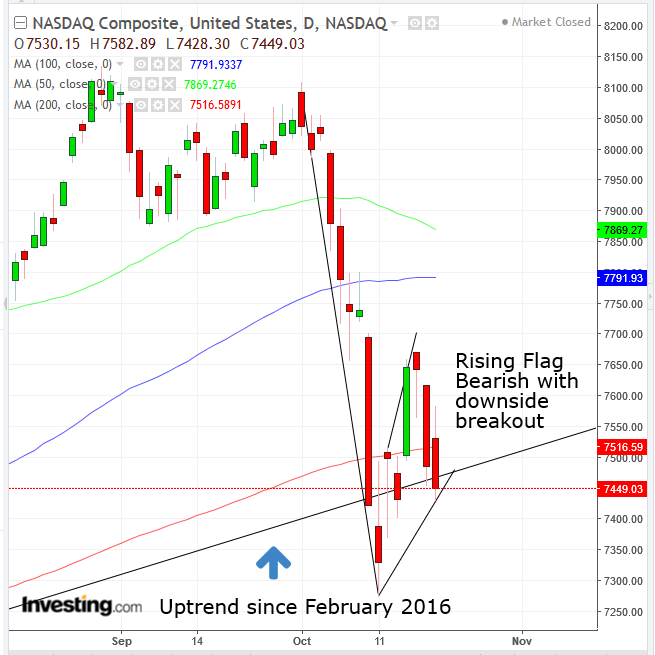
The NASDAQ plunged 0.48 percent, capping a three-day decline, as well as a three-week slide, losing 1.29 percent of value for the week. After crossing back above the 200 DMA in Friday’s early rally, it dropped back below it, where it closed for the weekend.
The Russell 2000 underperformed, falling 1.08 percent. It was down 0.59 percent for the week.
The Dow Jones Industrial Average was the only index to close in the green on Friday, up 0.26 percent. It gained 0.41 for the week, outperforming US peer indices and ending a three-day decline. However it found resistance at the 100 DMA.
The selloffs are still testing the very much current uptrend. What it all boils down to is strong economic data and earnings growth on the one hand, versus geopolitical risks on the other hand. Conservative traders should wait for confirmations of the trend's integrity, though more aggressive traders might view these selloffs as rare buying opportunities, with relatively minimal risk (if placing close stop-losses), as they receive the lowest stock prices relative to the uptrend since March.
DXY Daily
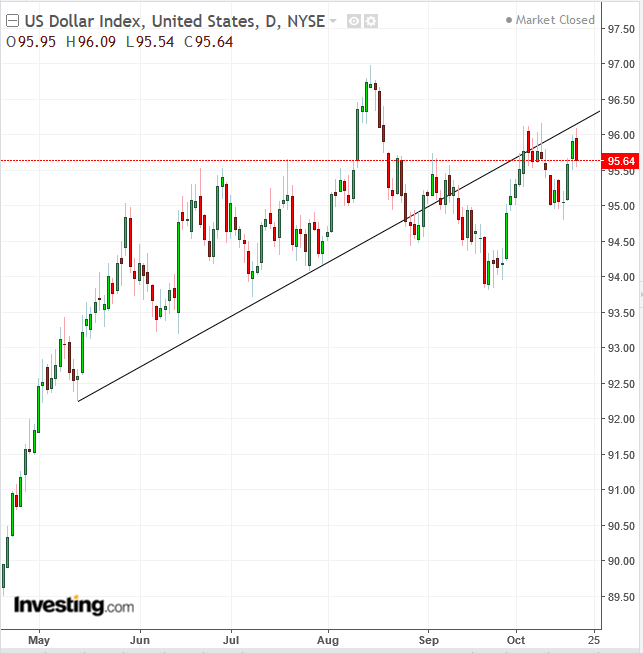
In FX markets, the dollar advanced 0.51 percent on a weekly basis. However, it lost 0.27 percent on Friday. This loss to close out the trading week is a bad omen for multiple technical reasons. It formed a bearish engulfing pattern, below the broken uptrend line since May 14, for the second time, and beneath the preceding early October peak.
Fundamentally, the credit market is demonstrating a growing tightening shortage, which has the potential to cause the next financial crisis.
Gold Daily
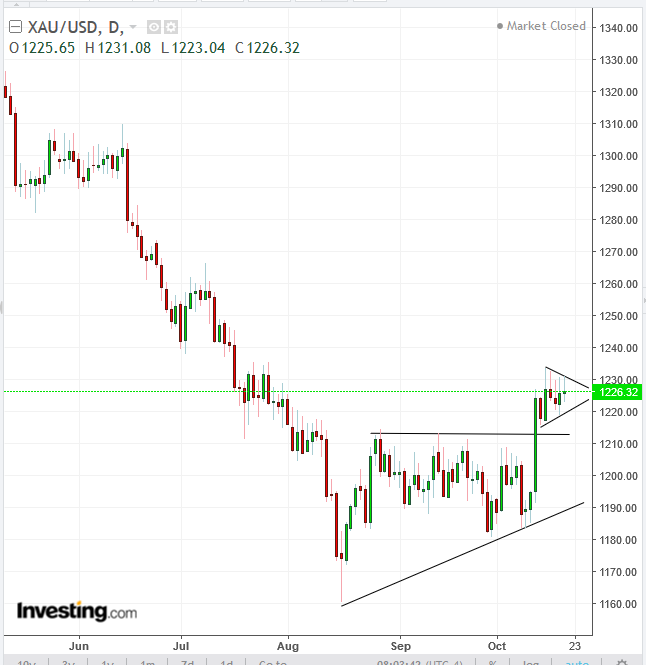
Such a dollar demise would, in all likelihood, boost gold. The yellow metal has been forming a pennant since last week, bullish with an upside breakout.
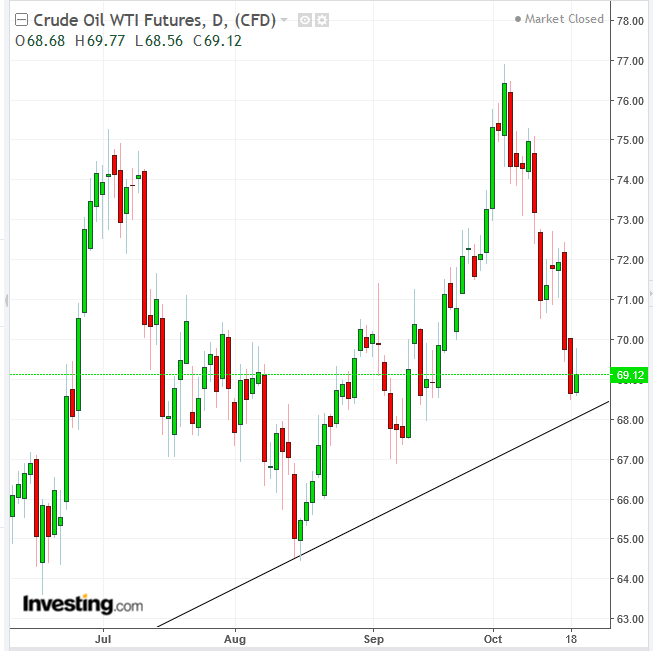
After the growing tensions between the US and Saudi Arabia over the disappearance of journalist Jamal Khashoggi provided a boost for oil prices, the commodity tumbled following a 6.5 million barrel increase in US inventories last week, the fourth in a row. Exports, on the other hand, were down 1.8 million BPD, according to the US Energy Information Administration. Oil stocks rose sharply even as US crude production slipped 300,000 bpd to 10.9 million bpd last week, which analysts attributed to the effects of offshore facilities closing temporarily for Hurricane Michael.
While oil markets look adequately supplied for now after a significant production increase, despite the earlier market narrative indicating otherwise, in the last six months the energy industry has been coming under strain. The International Energy Agency said in its monthly report that the world’s spare oil production capacity was down to 2% of global demand, with further slippage likely. Technically, the price found support on Friday above the uptrend line since June 2017.
- Forums
- ASX - Short Term Trading
- XAO
- Short Term Trading Week Starting: 22 Oct
Short Term Trading Week Starting: 22 Oct, page-4
-
- There are more pages in this discussion • 100 more messages in this thread...
You’re viewing a single post only. To view the entire thread just sign in or Join Now (FREE)
Featured News
Add XAO (ASX) to my watchlist
 (20min delay) (20min delay)
|
|||||
|
Last
8,703.1 |
Change
-51.600(0.59%) |
Mkt cap ! n/a | |||
| Open | High | Low |
| 8,754.7 | 8,757.2 | 8,695.5 |
Featured News
| XAO (ASX) Chart |


