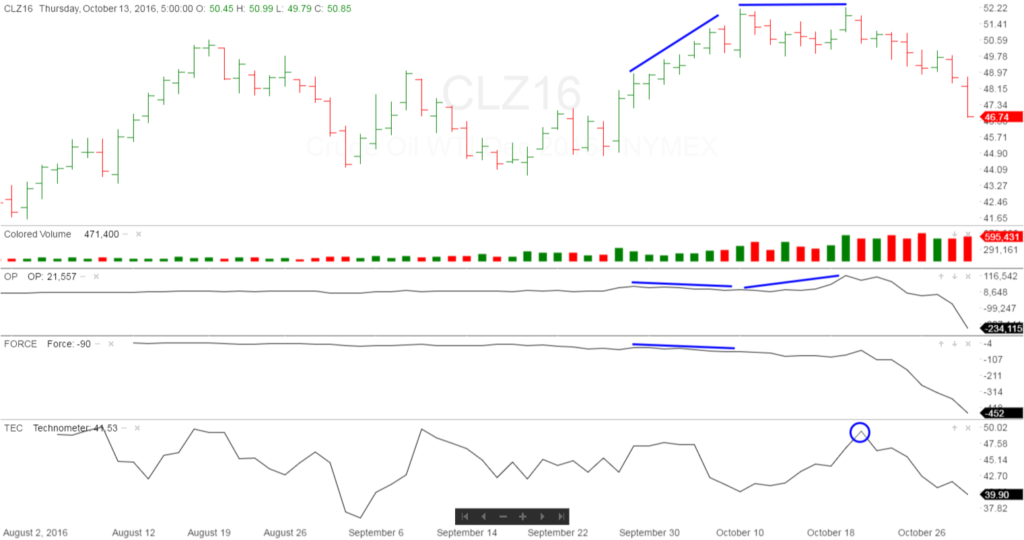
Here is something everyone might find interesting. This is a example of a Wyckoff double divergence.....
The following chart shows a recent double divergence between the OP/Price for December Crude Oil Futures.
You can see that as the Technometer reached overbought at the blue circle, the price made its final high, and has been in a sustained downtrend since. It is now entering oversold territory, so we would expect a corrective rally.

- Forums
- General
- Wyckoff trading method
Wyckoff trading method, page-1117
-
-
- There are more pages in this discussion • 1,342 more messages in this thread...
You’re viewing a single post only. To view the entire thread just sign in or Join Now (FREE)


